Zorora: Know the Asset Before You Buy It
Zorora gives energy traders and asset investors research reports, acquisition diligence, regulatory monitoring, and market intelligence — from a single interface. Ask a question, get a cited answer.
Analysts spend weeks assembling diligence packages from disconnected sources. Zorora synthesizes regulatory data, market pricing, academic research, and asset performance into structured reports automatically — across seven integrated modes covering the full workflow from initial research through pipeline tracking and investment decision.
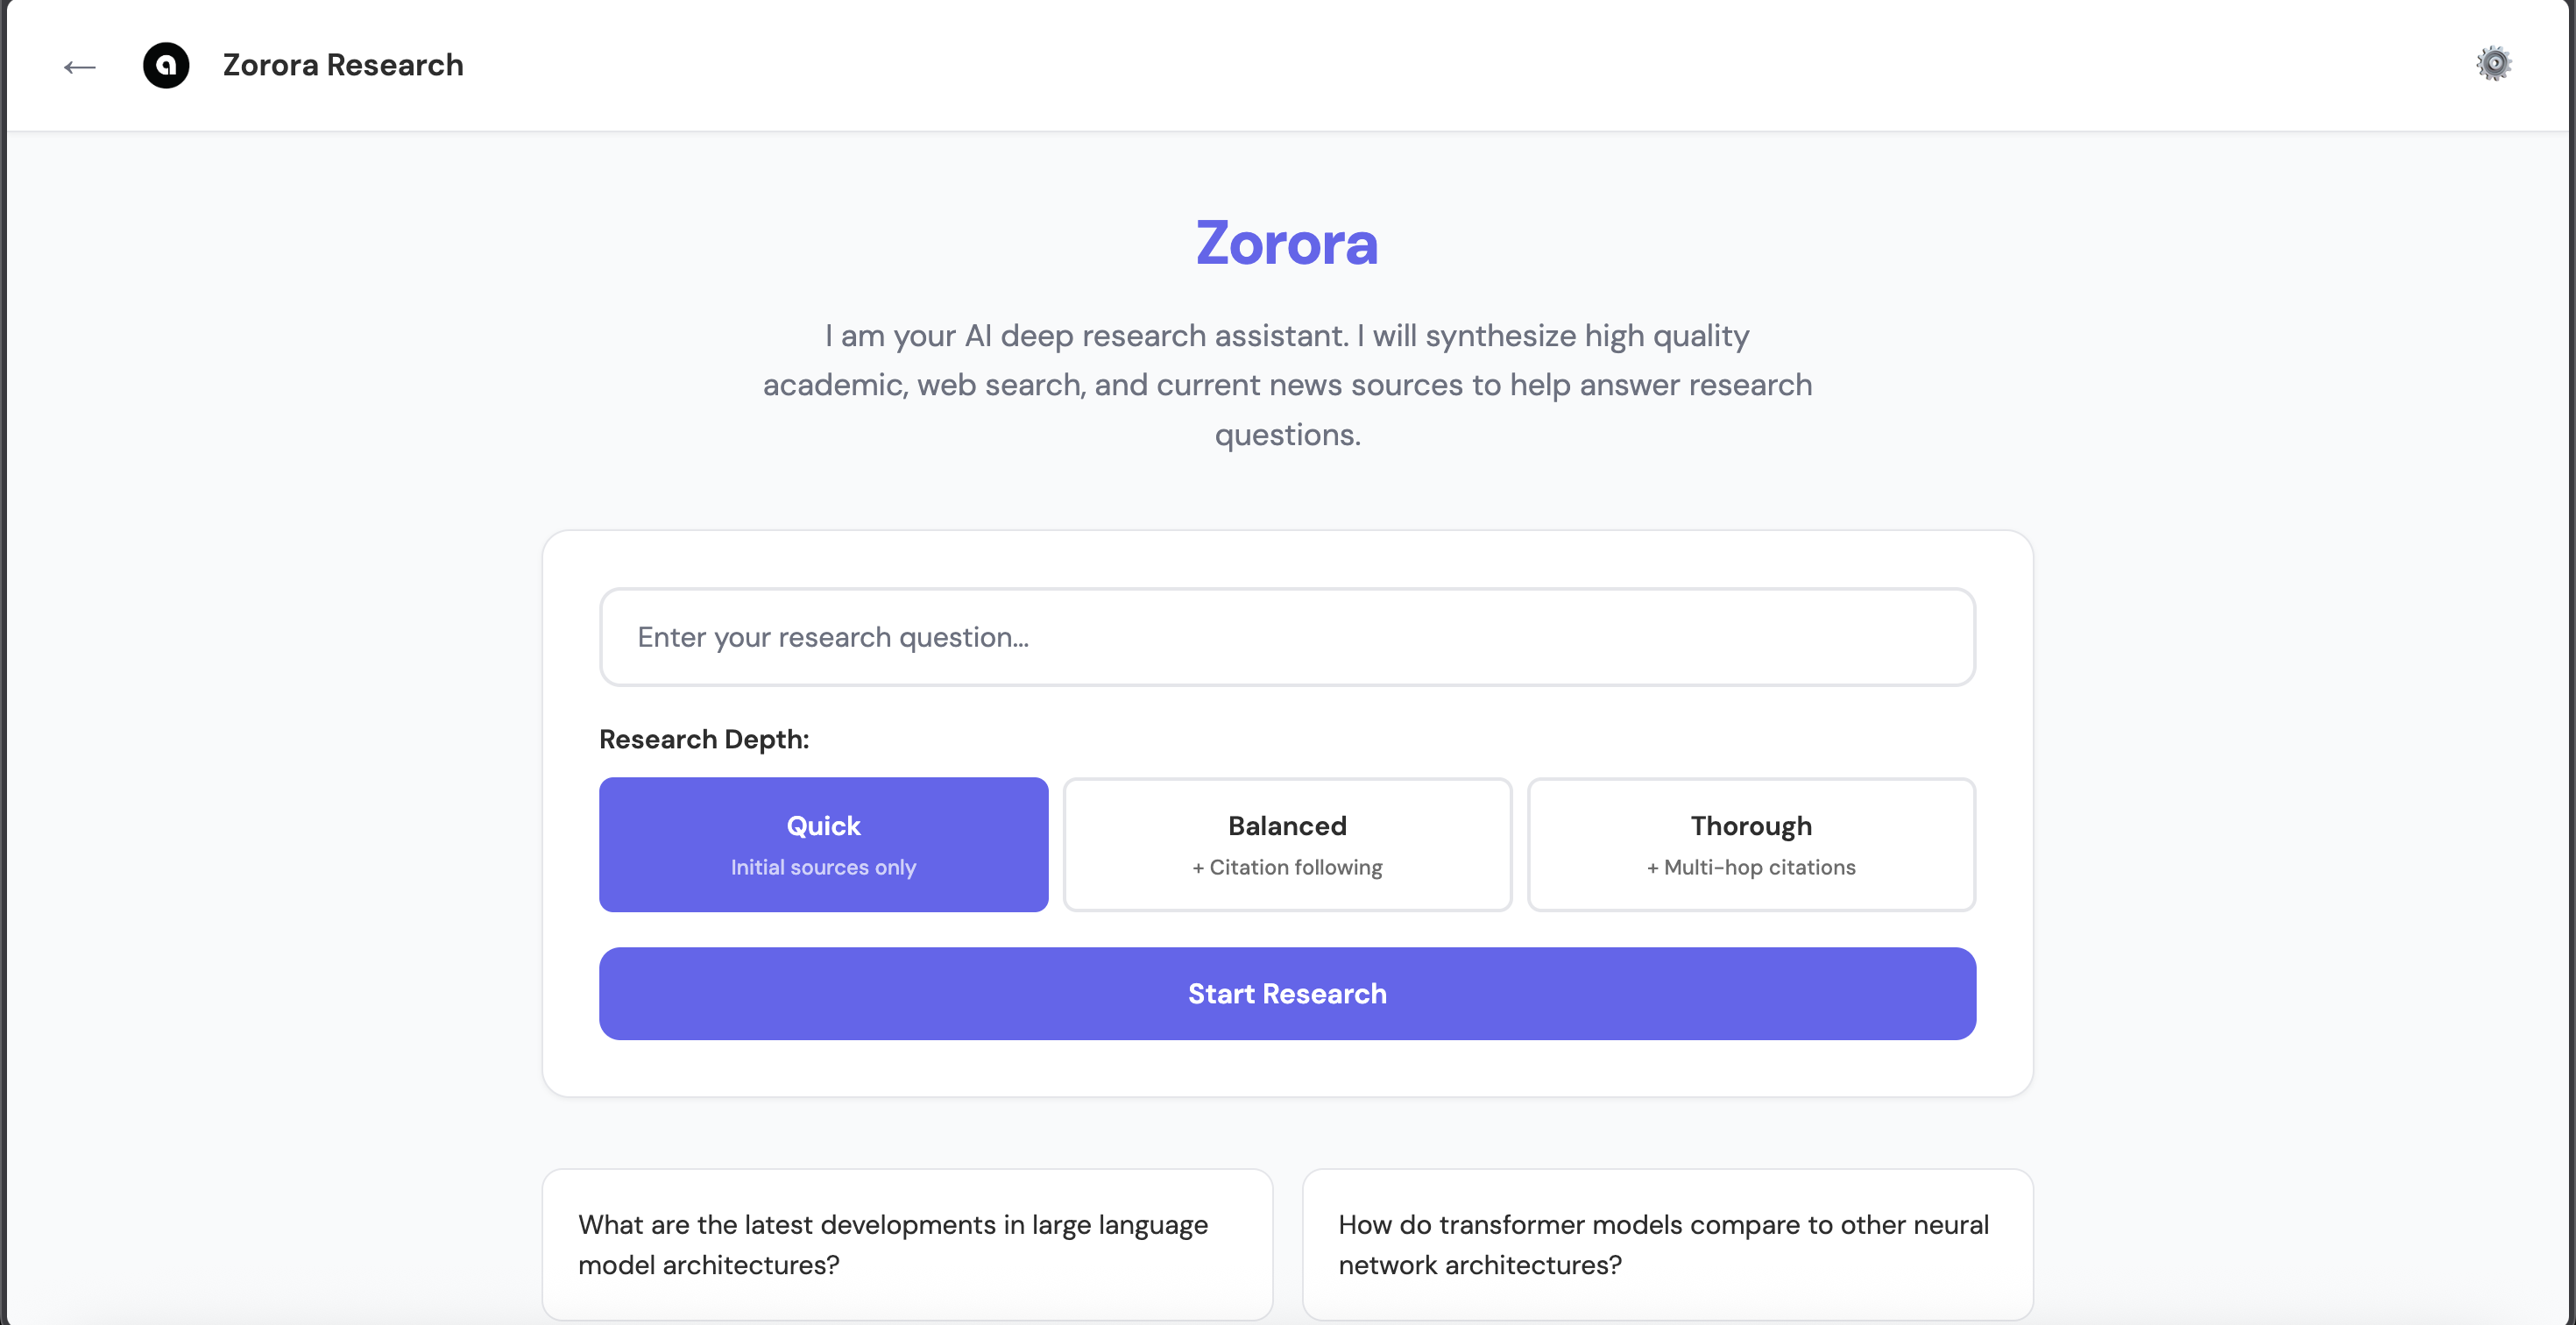
Zorora Web UI — browser-based interface for all users
What is Zorora?
Zorora is an energy intelligence platform with seven integrated modes:
- Deep Research — Cited research reports from academic databases, web, and newsroom sources with credibility scoring, citation graphs, and evidence-grounded synthesis. Includes diligence search for brownfield acquisition due diligence with structured data from EIA, utility rate, and World Bank databases.
- Digest — Stage articles and market datasets, then synthesize structured energy market and policy digests
- Alerts — Monitor topics and sources for new developments with configurable alert rules
- Regulatory — Track renewable portfolio standards, utility rates, generation assets, and regulatory environments by jurisdiction across South Africa, Zimbabwe, and the United States
- Global View — Interactive country map with geo-tagged articles, topic/source drill-down, and live commodity dataset cards (SAPP DAM prices, Eskom demand, FRED treasuries)
- Discovery — Satellite-based geospatial map with 1,144 mineral deposits, 739 generation assets, mining concessions, and transmission infrastructure. One-click research, diligence, or scouting from any asset popup.
- Scouting — Kanban pipeline for tracking brownfield, greenfield, and BESS opportunities through five evaluation stages (Identified, Scored, Feasibility, Diligence, Decision) with automated feasibility studies across production, trading, grid, regulatory, and financial dimensions.
Why Zorora Exists
Energy projects fail for reasons that don’t show up in financial models — grid connection delays, municipal tariff disputes, environmental permitting gaps, counterparty exposure to contractors that lost accreditation. The risks that kill energy deals are regulatory, political, and operational. The records are scarce, scattered across government gazettes, regulatory feeds, and local newsrooms in formats no spreadsheet can aggregate.
Zorora surfaces the specific non-financial factors that determine whether a project reaches commercial operation:
- Regulatory risk — tariff redetermination mid-PPA, licensing freezes
- Grid connection — GCAR delays, capacity allocation disputes
- Municipal — billing disputes, distribution asset agreement gaps
- Counterparty — O&M accreditation lapses, operator insolvency
- Environmental — permitting gaps, EIA delays
- Political — policy reversal, land expropriation risk
Core Value Proposition
- Cited Research, Not Chat Answers — Every claim cites its source. When sources disagree, Zorora tells you exactly where and why.
- Non-Financial Risk Surfacing — Regulatory, environmental, and counterparty risks from fragmented sources that general-purpose tools don’t index
- Complete Privacy — All processing and storage on your machine
- Local-First Architecture — Zero cloud dependencies (except source fetching)
- Web UI — Browser-based interface for all users
- Multi-Provider Support — Configure models from LM Studio (local), HuggingFace, OpenAI, and Anthropic
Core Features
Platform Modes
| Mode | What it does |
|---|---|
| Deep Research | Cited research reports: parallel source aggregation (academic, web, newsroom) → credibility scoring → evidence-grounded synthesis with inline citations. Includes diligence search for brownfield due diligence with structured EIA/utility/World Bank data. |
| Digest | Stage articles and market datasets, synthesize structured energy market and policy digests |
| Alerts | Monitor topics and sources for new developments with configurable alert rules |
| Regulatory | Regulatory events (NERSA, ZERA, FERC), renewable portfolio standards, utility rates, and generation data by jurisdiction |
| Global View | Interactive country map with geo-tagged articles, topic/source drill-down, and live commodity dataset cards |
| Discovery | Satellite geospatial map with 1,144 mineral deposits, 739 generation assets, concessions, and transmission infrastructure |
| Scouting | Kanban pipeline for brownfield/greenfield/BESS opportunities with 5-stage tracking and automated feasibility studies |
Research Depth Levels
- Quick - Initial sources only (skips citation following, depth=1, ~25-35s)
- Balanced - Adds citation following (1 hop, depth=2, ~35-50s) - Coming soon
- Thorough - Multi-hop citation exploration (up to 3 levels deep, depth=3, ~50-70s) - Coming soon
Additional Capabilities
- Data analysis - Sandboxed Python execution with pandas, numpy, and matplotlib
- Comparative queries - Auto-detects “X vs Y” queries and generates dimension-based comparison tables
- Deterministic routing - Pattern-based decision tree (no LLM routing failures)
- Hybrid deployment - Local 4B orchestrator + remote 32B specialists
- Multi-provider support - Configure models from HuggingFace, OpenAI, and Anthropic APIs
- Vision and image generation - Dedicated models for image analysis and text-to-image generation
Architecture
Zorora uses deterministic routing with pattern matching instead of LLM-based orchestration. This design choice enables reliable operation with small 4B models while maintaining RAM efficiency.
Design Philosophy
- Deterministic over clever - Code-controlled workflows, not LLM orchestration
- Research-first - Optimized for multi-source synthesis and citation management
- RAM-efficient - Runs on MacBook Air with 4B orchestrator model
- Persistent knowledge - Save and retrieve research findings locally
- Simple and reliable - Hardcoded pipelines that just work
Architecture Diagram
User Query / Web UI Request
    ↓
Pattern Matching (simplified_router.py) / Flask Routes (ui/web/app.py)
    ↓
    ├─→ DEEP RESEARCH (6-phase pipeline)
    │   ├─► Parallel Source Aggregation (academic, web, newsroom)
    │   ├─► Citation Following → Cross-Referencing → Credibility Scoring
    │   ├─► Citation Graph Building
    │   └─► Contract-Based Synthesis (Nehanda v3)
    ├─→ DILIGENCE SEARCH (domain-specific due diligence)
    │   ├─► Query Decomposition (tariffs, regulations, performance, vendors)
    │   ├─► Structured Data (EIA, utility rates, RPS, World Bank, generation assets)
    │   └─► Diligence Report Synthesis with Charts
    ├─→ DIGEST (staged article + dataset synthesis)
    ├─→ ALERTS (topic/source monitoring)
    ├─→ REGULATORY (RPS, utility rates, generation data by jurisdiction)
    ├─→ GLOBAL VIEW (country map + market datasets)
    ├─→ DISCOVERY (geospatial OSINT — deposits, generation, concessions)
    ├─→ SCOUTING (kanban pipeline + feasibility studies)
    └─→ DATA ANALYSIS (sandboxed Python + matplotlib)
Key Principles
- No LLM-based orchestration - Patterns determine routing, code controls execution
- Hardcoded workflows - Fixed pipelines for predictable results
- Persistent research - Everything saved to
~/.zorora/research/with metadata - Specialist models - Nehanda v3 for synthesis, vision for images
- Multi-provider support - Configure models from LM Studio (local), HuggingFace, OpenAI, and Anthropic APIs
- Visual configuration - Web UI settings modal for easy model/endpoint management
Core Components
1. Simplified Router (simplified_router.py)
Uses pattern matching to route queries to workflows. No LLM involved - pure pattern matching ensures consistent, fast routing (0ms decision time).
2. Research Engine (engine/research_engine.py)
High-level interface for deep research:
- Starting research
- Loading past research
- Searching research history
- Executing deep research workflow
3. Deep Research Workflow (workflows/deep_research/)
Hardcoded pipeline for multi-source research:
aggregator.py- Source aggregationcredibility.py- Credibility scoringsynthesizer.py- Synthesis generationworkflow.py- Workflow orchestrator
4. Storage Layer (engine/storage.py)
Local-first storage:
- SQLite database (
~/.zorora/zorora.db) for fast indexed queries - JSON files (
~/.zorora/research/findings/) for full research state
5. Web UI (ui/web/app.py)
Flask-based web interface with seven modes:
- Deep Research, Digest, Alerts, Regulatory, Global View, Discovery, and Scouting
- Settings modal for multi-provider model configuration
- Two-column layout with persistent research history sidebar
Synthesis Model: Nehanda v3
Zorora uses the Nehanda v3 model (27B, fine-tuned Qwen3.6) for evidence-grounded synthesis in Deep Research. Nehanda v3 scores 88.7% on FACTS Grounding — above Gemini 2.5 Pro, Claude 3.5 Sonnet, and GPT-4o. The model is hosted at nehanda.asoba.co:8000 via vLLM with tensor parallelism.
Local-First Design
Storage Architecture
Research Request
    ↓
ResearchEngine.deep_research()
    ↓
DeepResearchWorkflow.execute()
    ↓
LocalStorage.save_research()
    ├─► SQLite Index (~/.zorora/zorora.db)
    │   ├─► research_findings (metadata)
    │   ├─► sources (indexed)
    │   └─► citations (graph)
    └─► JSON Files (~/.zorora/research/findings/<id>.json)
        └─► Full research state (sources, findings, synthesis)
Privacy & Control
- All processing on your machine - No cloud computation
- Local storage only - Research data never leaves your machine
- Zero cloud dependencies - Except source fetching (academic databases, web search)
- Complete control - You own all data, all outputs, all chats
Performance
- Routing decision: 0ms (pattern matching, no LLM)
- Research workflow: Varies by depth
- Quick (depth=1): ~25-35s
- Balanced (depth=2): ~35-50s - Coming soon
- Thorough (depth=3): ~50-70s - Coming soon
- Storage queries: <100ms (SQLite indexed)
- RAM usage: 4-6 GB (4B orchestrator model)
Why This Architecture?
Problem: 4B Models Can’t Orchestrate
Traditional multi-model orchestration requires the LLM to:
- Generate valid JSON plans
- Make routing decisions
- Handle multi-step iteration
- Recover from tool failures
4B models fail at all of these. They can’t reliably generate JSON, struggle with function calling, and get stuck in loops.
Solution: Code Handles Complexity
Instead of asking the 4B model to be smart, we made the code smart:
- Pattern matching routes queries (no LLM decision)
- Hardcoded workflows execute pipelines (no LLM planning)
- Fixed iteration count (no LLM loop detection)
- Deterministic error handling (no LLM recovery)
Result: 100% reliability with 4B models, 1/3 the RAM usage of 8B orchestrators, complete privacy with local storage.
Trade-offs
What we lost:
- Flexibility for complex multi-tool queries
- LLM creativity in tool selection
- Adaptive workflows based on results
What we gained:
- 100% routing reliability (pattern matching never fails)
- Predictable behavior (same query = same workflow)
- RAM efficiency (4B model = 4-6 GB vs 8B = 12-16 GB)
- Simple debugging (no “why did it choose that tool?”)
- Fast responses (no LLM routing overhead)
Quick Start
Installation
Install from GitHub:
pip install git+https://github.com/AsobaCloud/zorora.git
Run Your First Query
Web UI:
zorora web
# Opens at http://localhost:5000
API:
from engine.research_engine import ResearchEngine

engine = ResearchEngine()
state = engine.deep_research("Your research question", depth=1)
print(state.synthesis)
Next Steps
- Getting Started - Installation and configuration guide
- Guides - Comprehensive guides for all features
- API Reference - Programmatic access documentation
- Technical Concepts - Deep dive into architecture
- Use Cases - Real-world examples
See Also
- Architecture Documentation - Detailed architecture explanation
- Research Pipeline - How the 6-phase pipeline works
- Storage Design - Local-first storage architecture
- Routing Mechanism - Deterministic pattern matching