Platform Guide
Zorora gives energy traders and asset investors research reports, acquisition diligence, regulatory monitoring, and market intelligence from a single interface. This guide walks through each screen.
Deep Research
Deep Research is the primary mode. Enter a research question, select a depth level, and Zorora synthesizes a structured report from academic, web, and newsroom sources with inline citations and credibility scores.
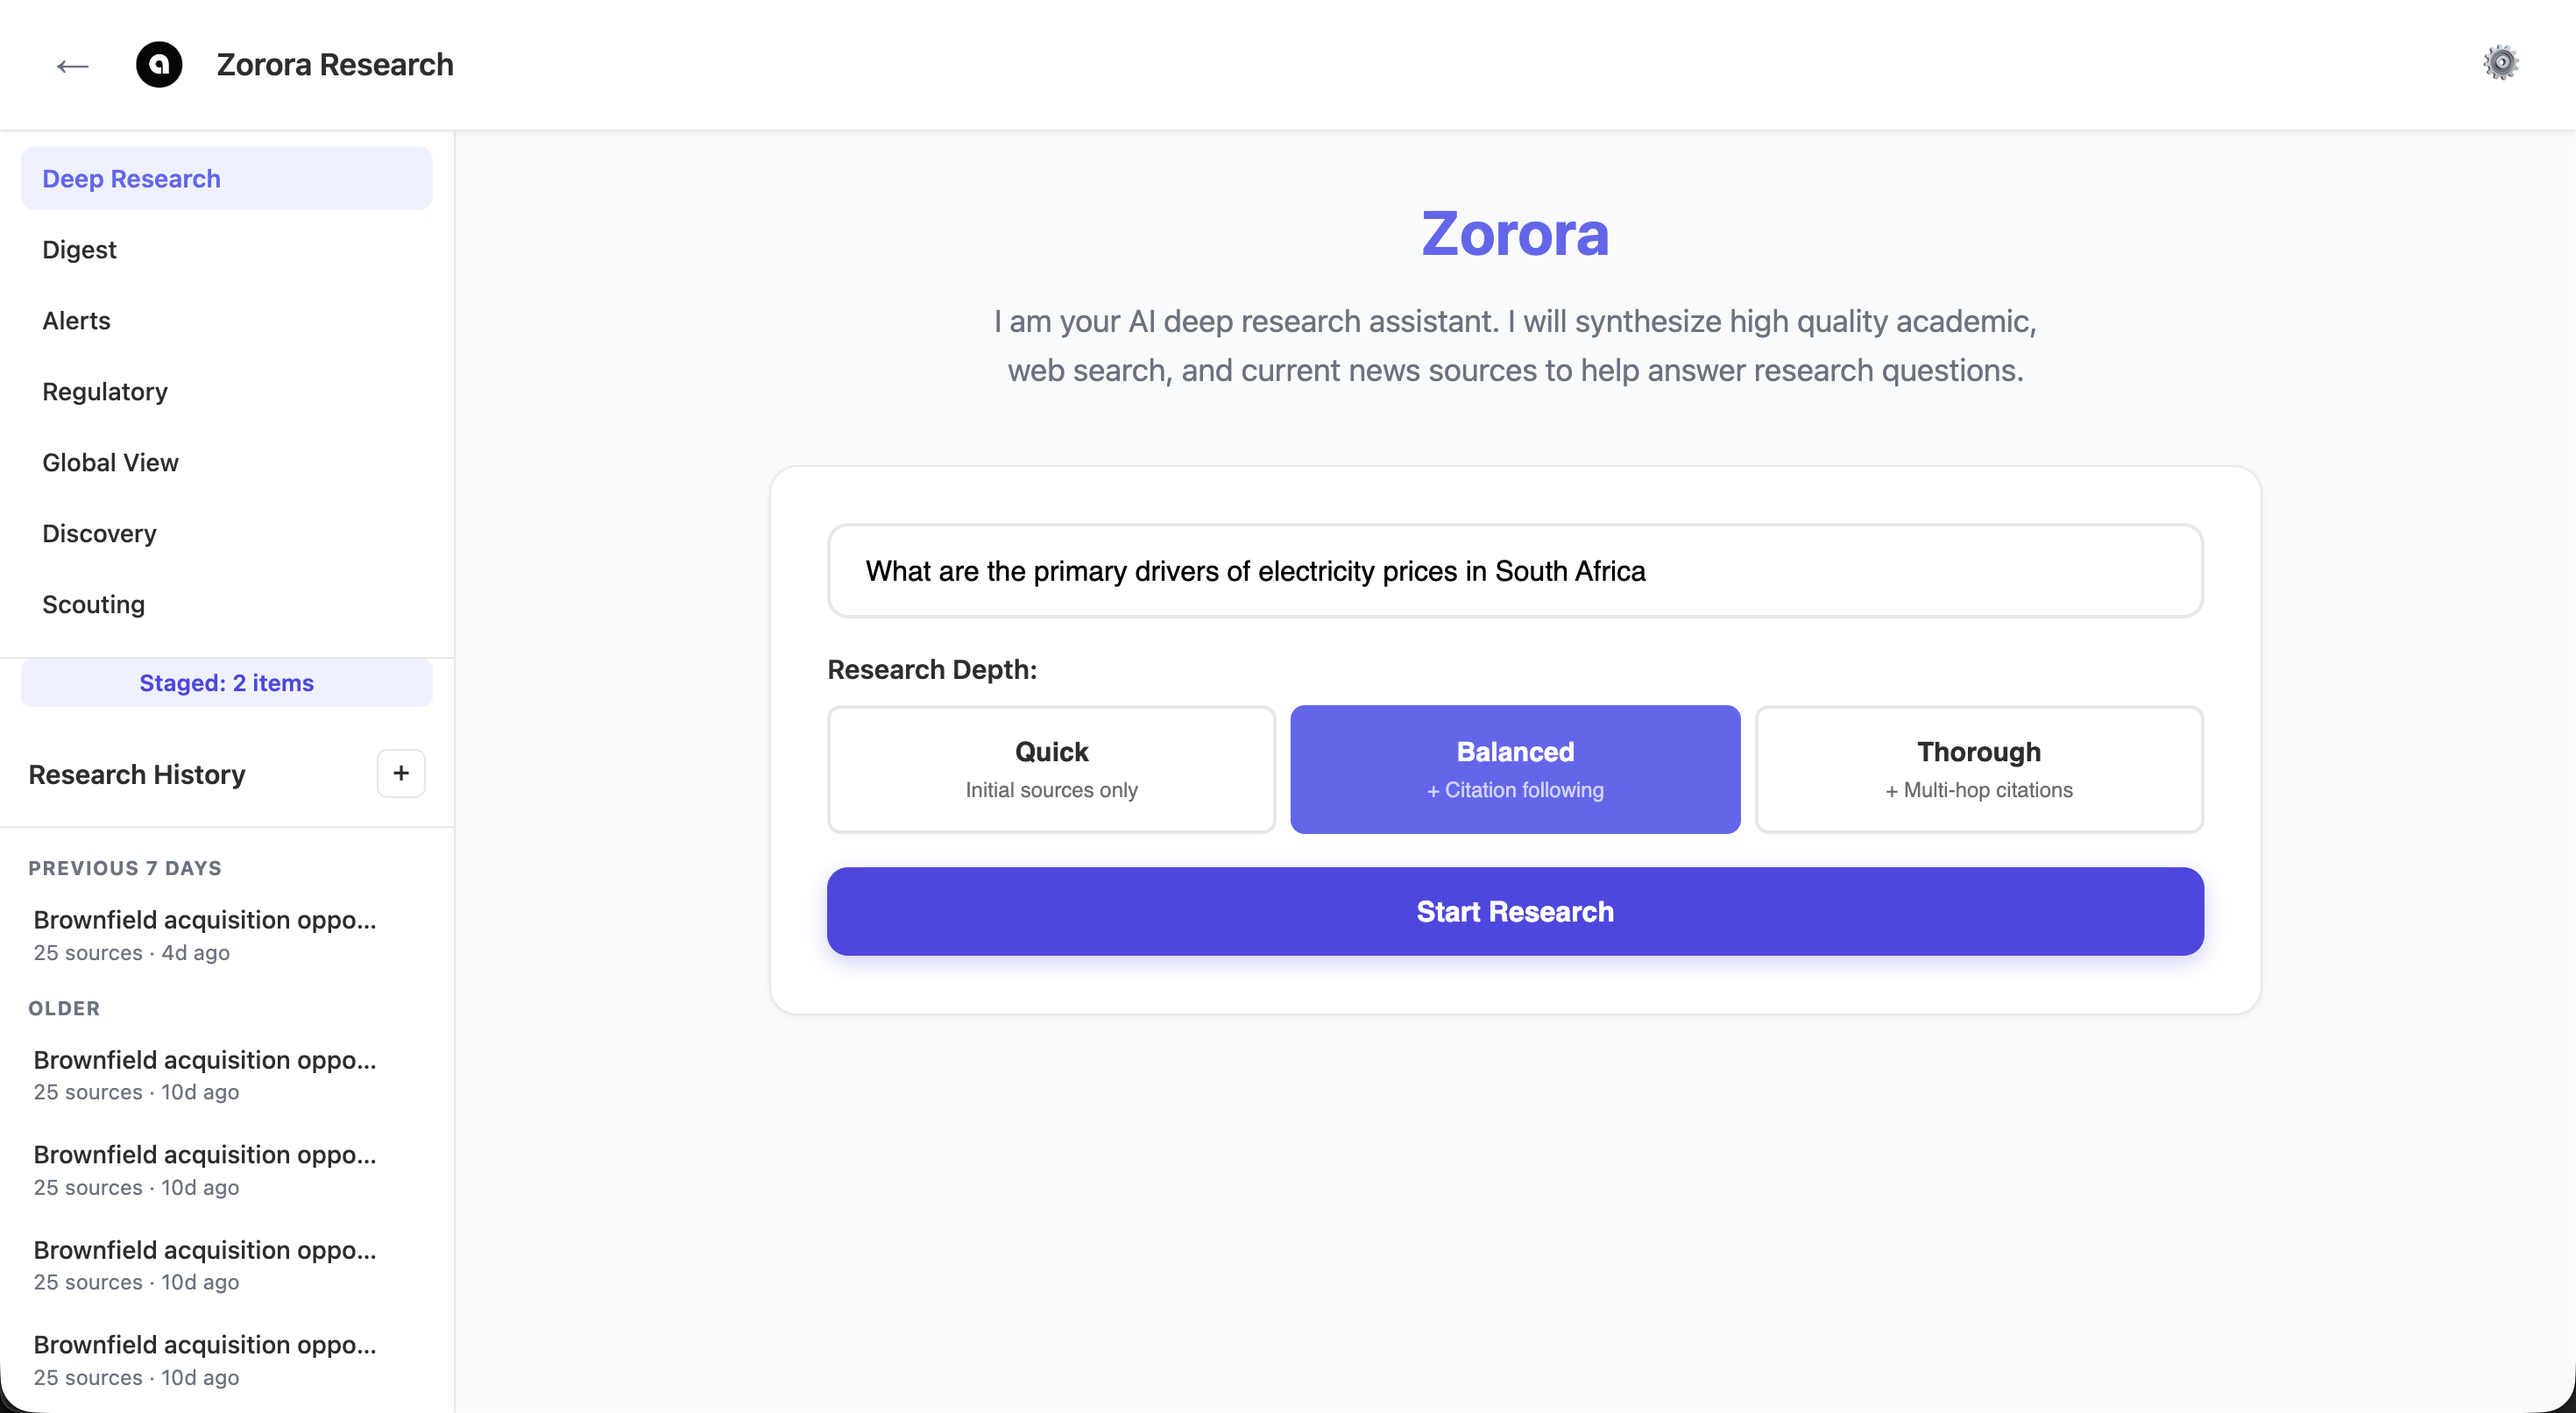
Enter a research question and select depth: Quick (initial sources), Balanced (+ citation following), or Thorough (+ multi-hop citations)
After submitting, Zorora may detect missing dimensions in your query — time period, analysis type, or scope — and prompt you to refine the research intent before running.
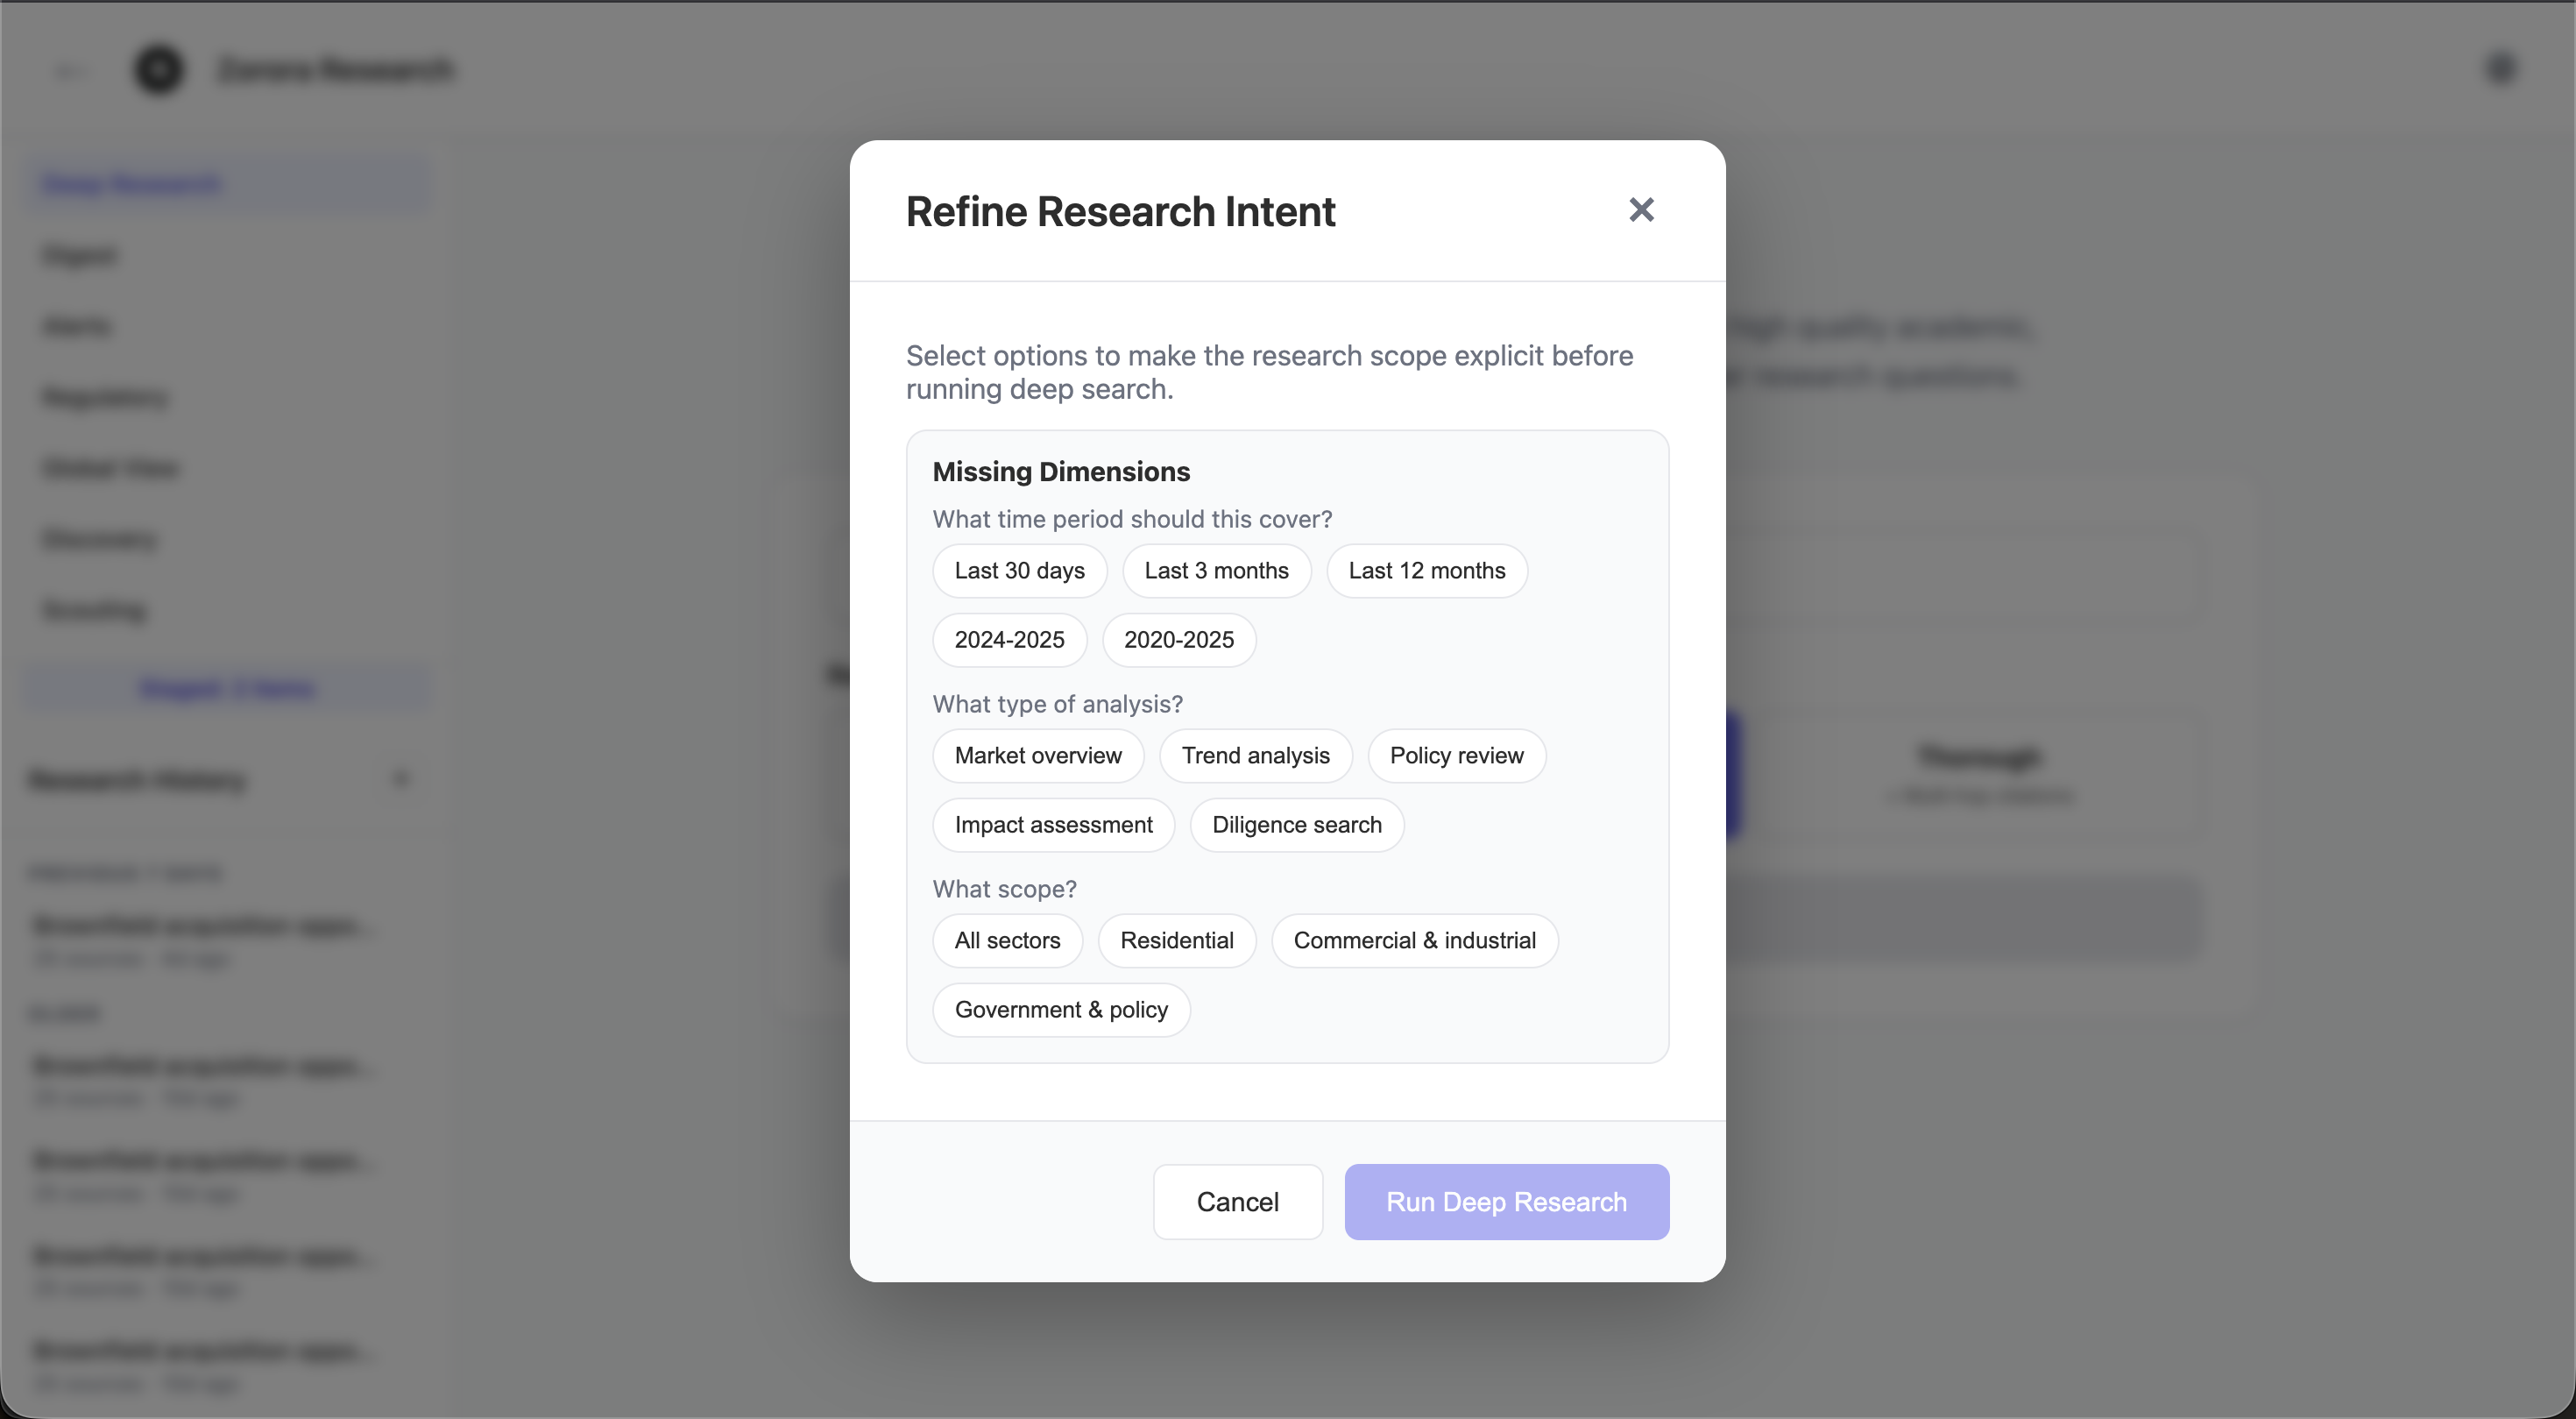
The Refine Research Intent modal lets you narrow the time period, analysis type (market overview, trend analysis, policy review, impact assessment, diligence search), and scope before executing
Results appear as a synthesis with inline source citations on the left and a credibility-scored sources panel on the right. Sources are filterable by type (Newsroom, Web, Academic). You can ask follow-up questions grounded in the same source material using the chat input at the bottom.
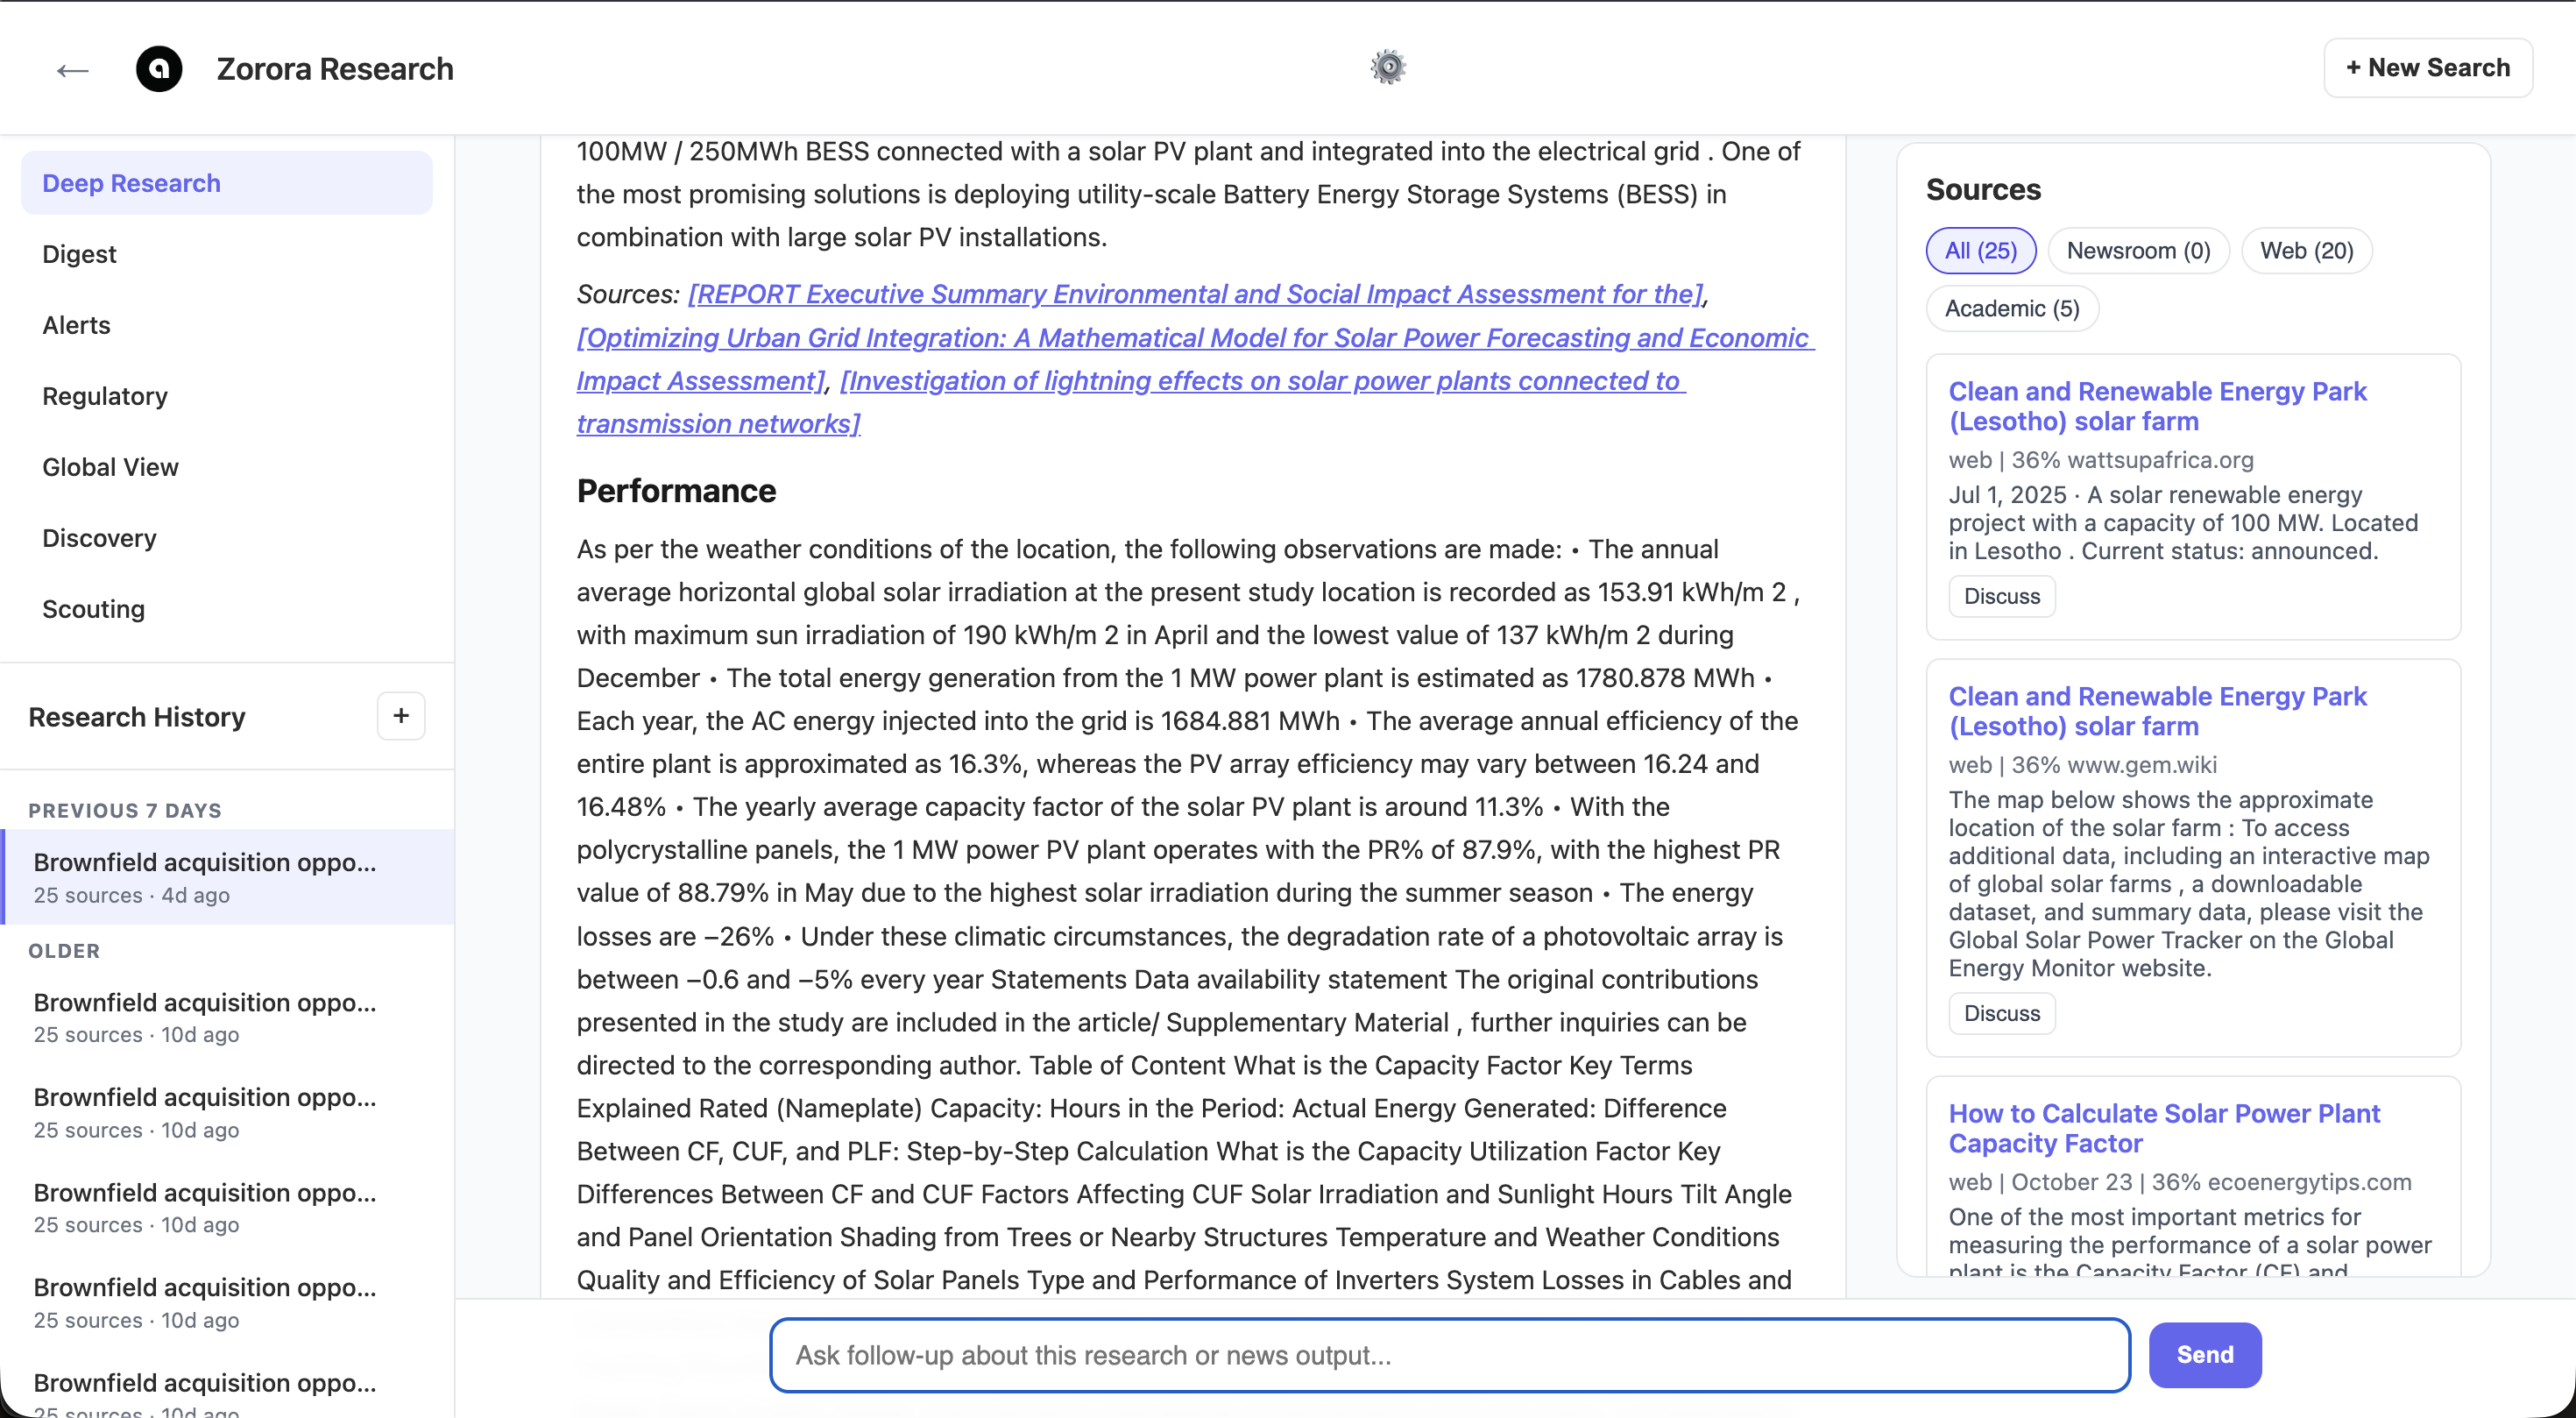
Research synthesis with inline citations, credibility-scored sources panel, and follow-up chat. Each source shows its type, credibility percentage, and date.
Key capabilities:
- Parallel source aggregation across academic databases (PubMed, OpenAlex, Semantic Scholar), web search, and curated newsroom feeds
- Multi-factor credibility scoring with predatory publisher detection
- Diligence search mode for brownfield acquisition due diligence with structured data from EIA, utility rates, and regulatory databases
- Research memory: thumbs up/down feedback, persistent chat threads, and scouting feasibility findings as internal sources
- Research history in the left sidebar for resuming past sessions
Digest
Digest lets you stage articles and market datasets, then synthesize a structured brief. Stage items from Global View by clicking “Staged” on any commodity card or article, then switch to Digest to combine them with a topic filter and date range.
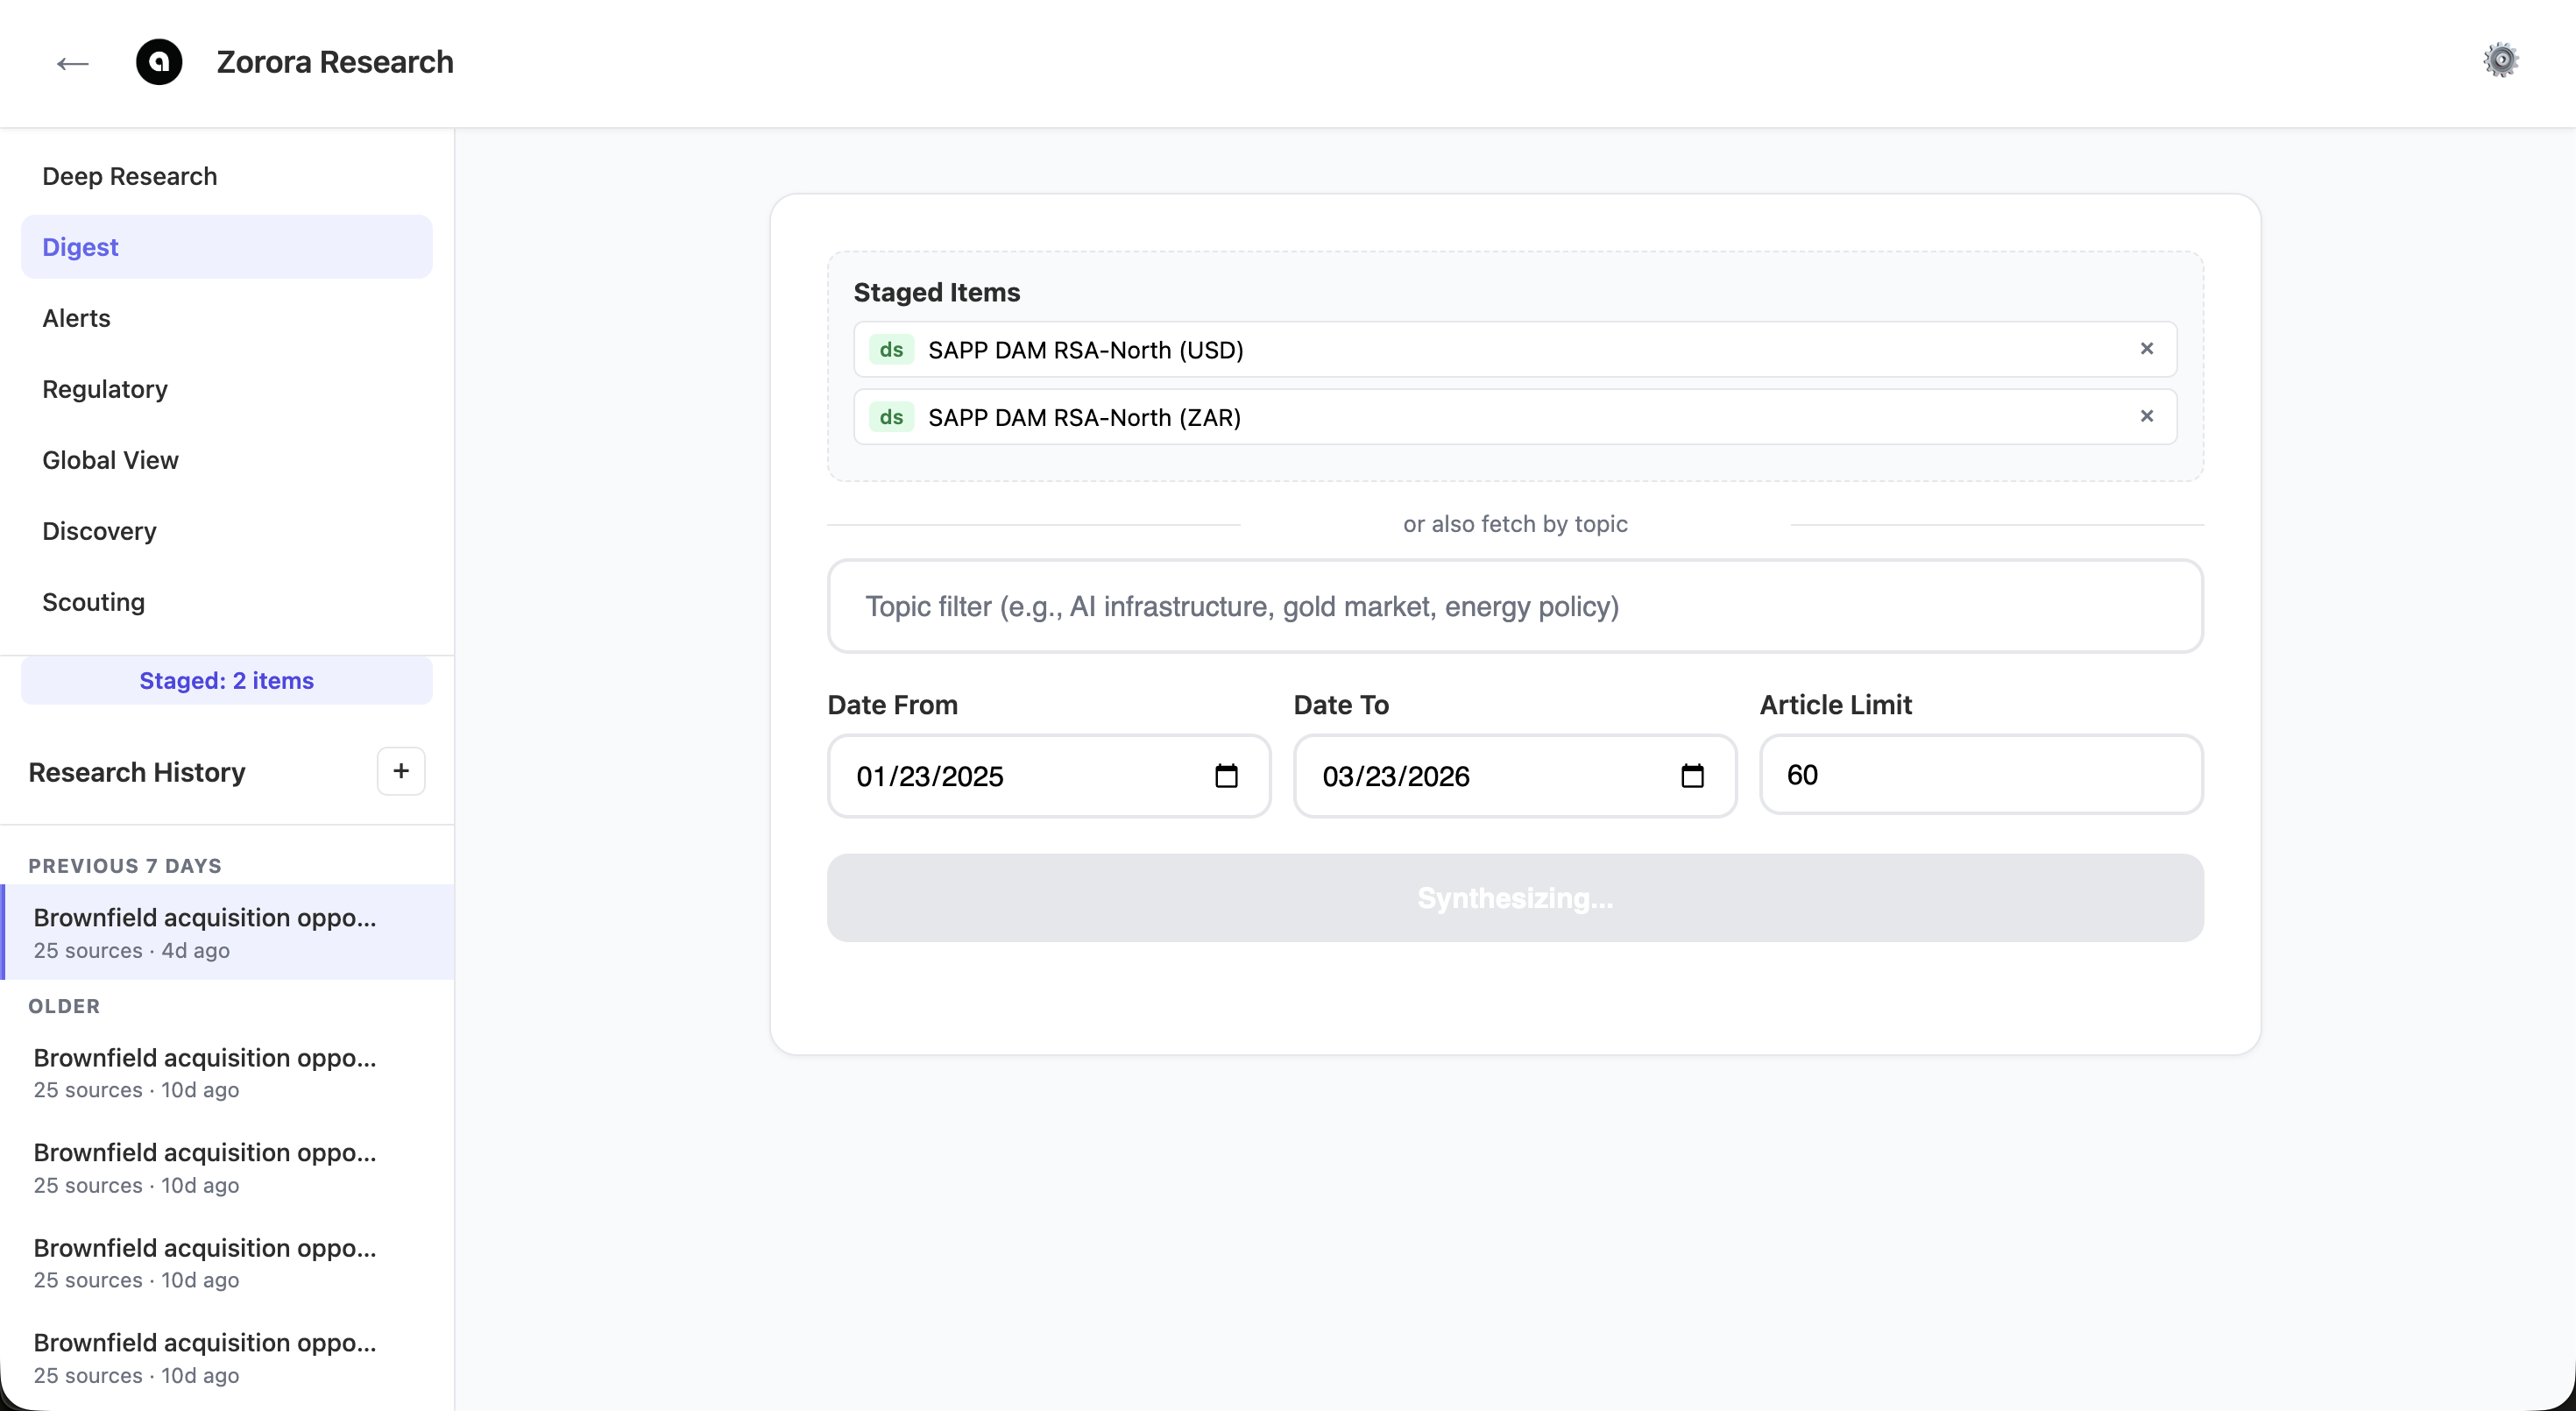
Two SAPP DAM price datasets staged for synthesis, with topic filter and date range controls. Click Synthesize to generate a structured market brief.
Key capabilities:
- Stage any combination of commodity datasets and newsroom articles
- Filter by topic (e.g., AI infrastructure, gold market, energy policy)
- Set date range to scope the synthesis window
- Configure article limit for large corpora
- Follow-up discussion grounded in the digest context
Alerts
Alerts monitors topics on a recurring schedule, synthesizing newsroom articles and surfacing matching regulatory events. Create a watch — such as “south africa renewable energy” with daily frequency — and Zorora will periodically check for new developments and surface them as unread results.
There are two ways to create an alert:
- Direct creation: Click the “+ New Alert” button in the Alerts section header. This opens a modal where you enter a name, topic (keywords to match in articles and regulatory events), date window (1–90 days), and frequency (daily or weekly).
- From Digest: After running a Digest synthesis, click “Save as Alert” to pre-fill the modal with the Digest’s topic and date range.
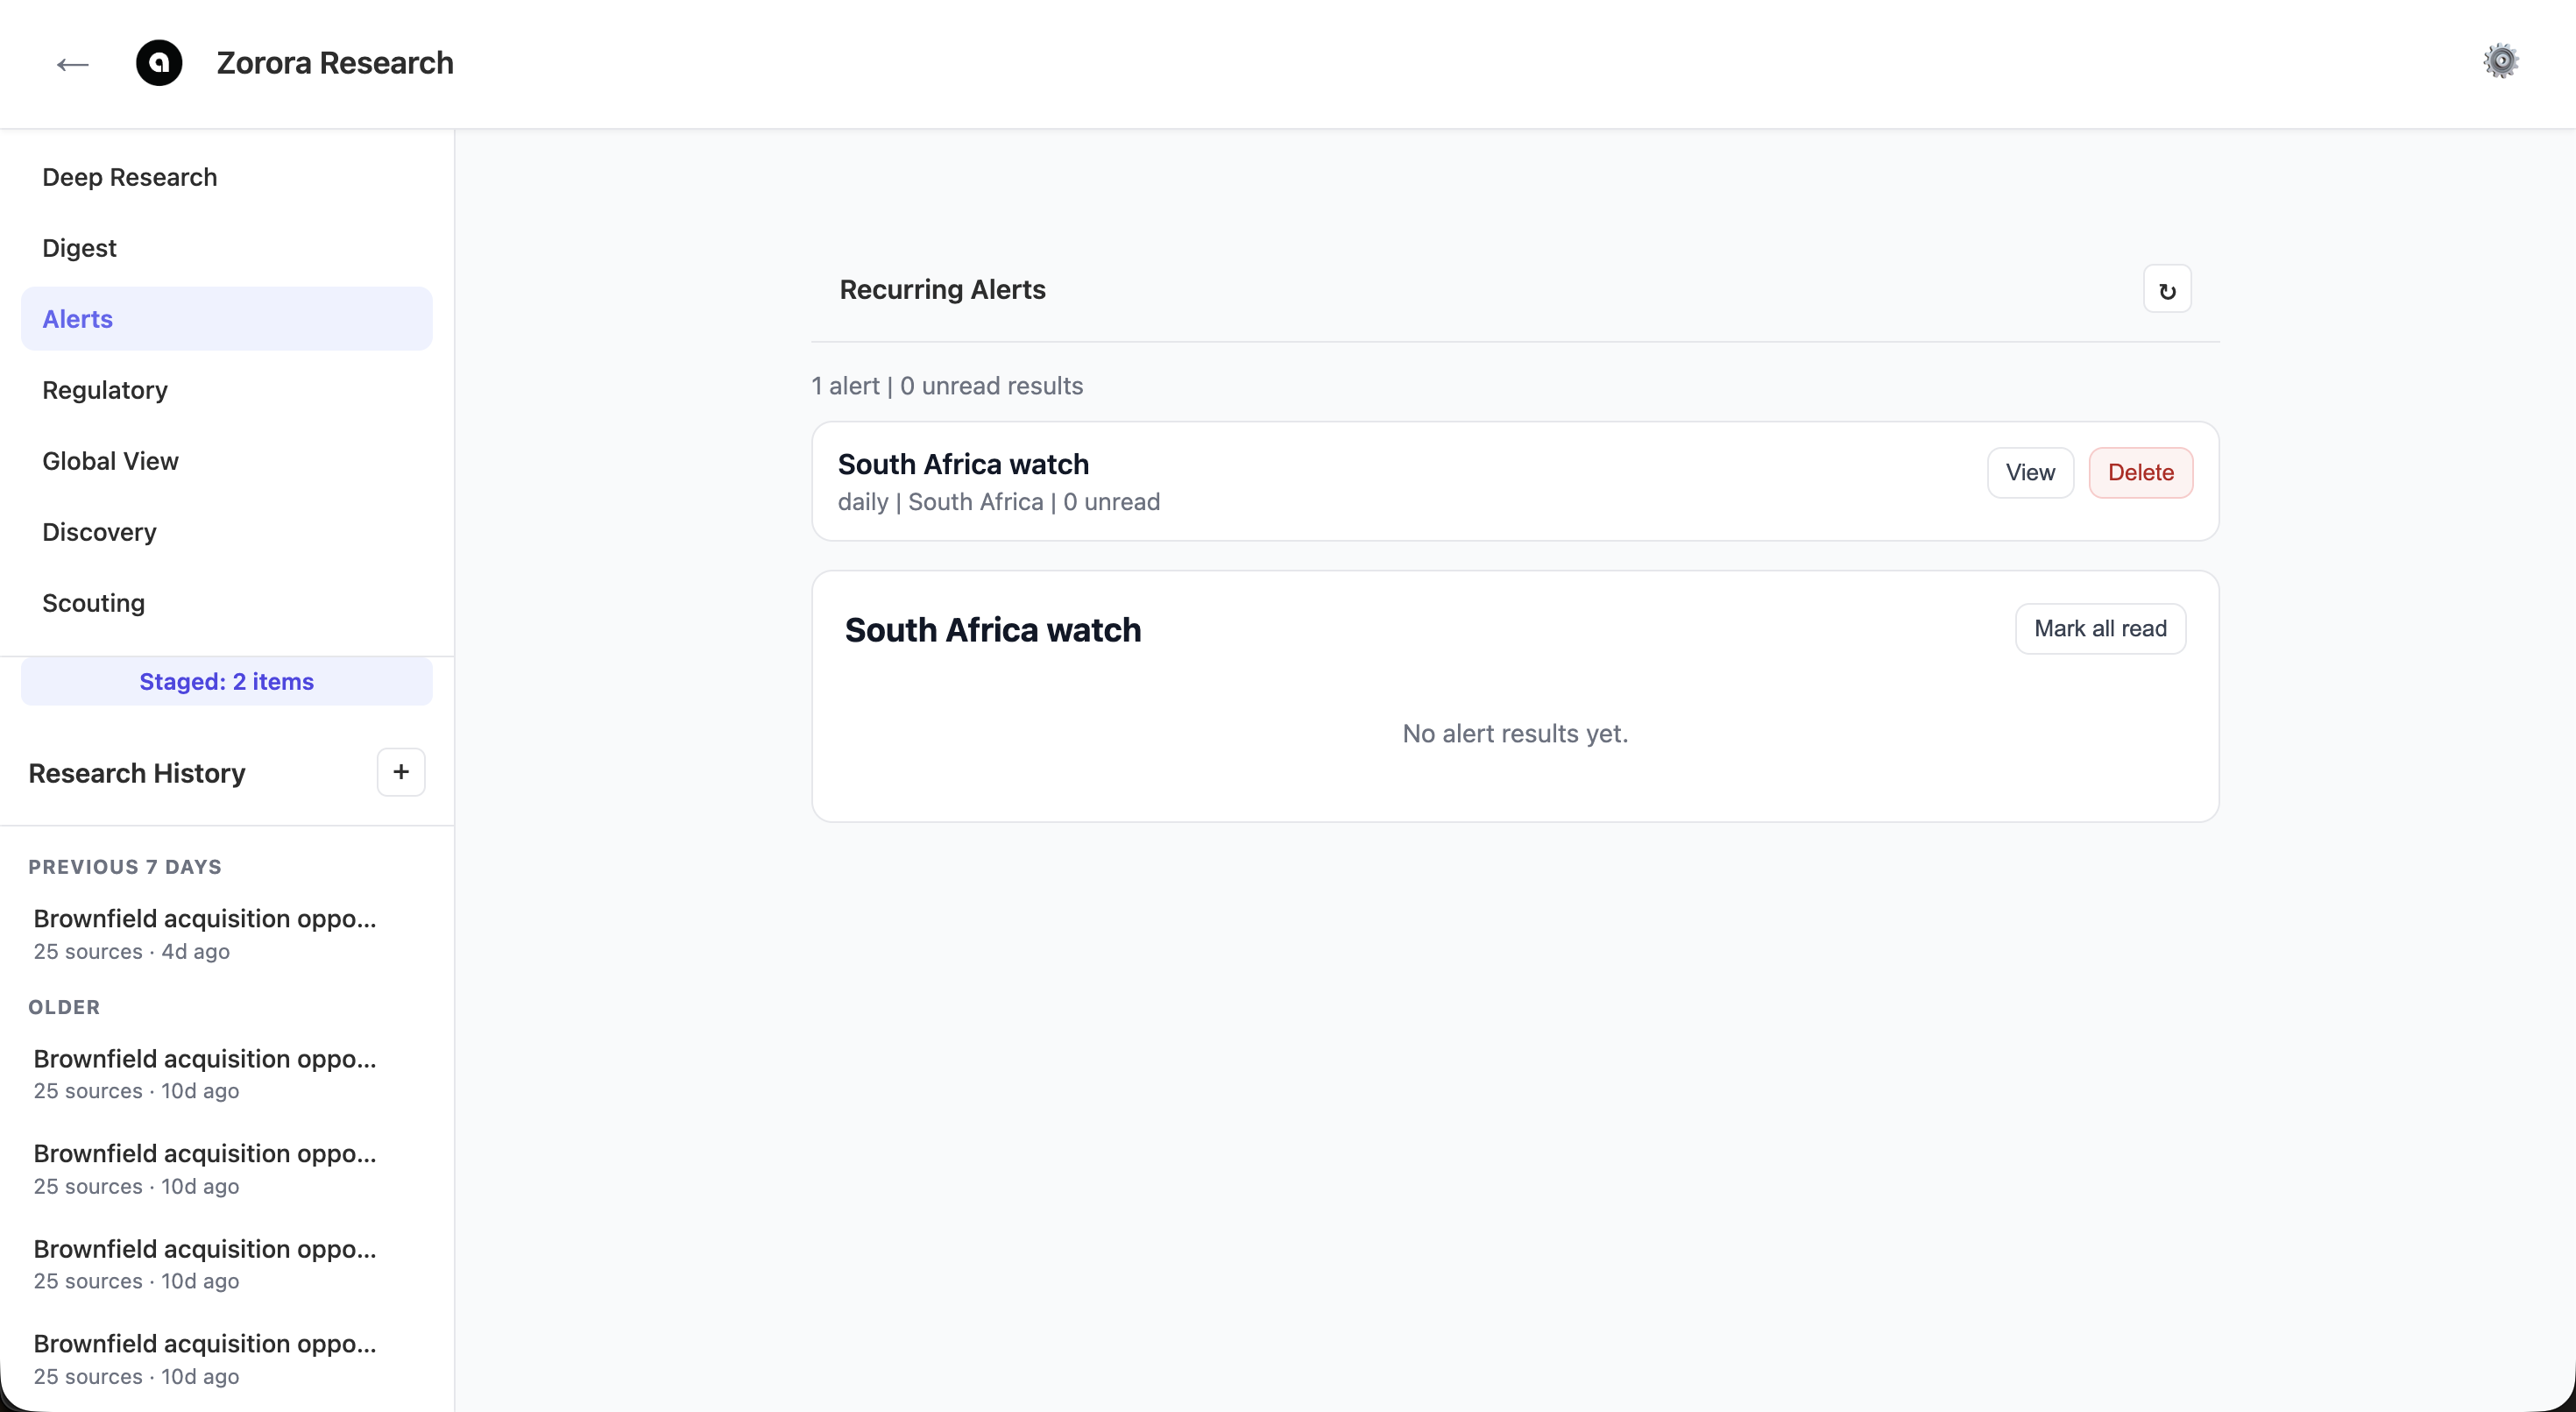
Recurring alerts dashboard showing a daily South Africa watch. View results, mark as read, or delete alerts.
When an alert runs, Zorora fetches newsroom articles and regulatory events matching the topic within the date window, synthesizes the articles into a brief, and stores the result. Each result shows the synthesis text, article count, and a “Regulatory Events” section listing matching events with their title, jurisdiction, event type, publication date, and summary.
Key capabilities:
- Create alerts directly from the Alerts section via “+ New Alert” button
- Topic-based matching across both newsroom articles and regulatory events
- Configurable date window (1–90 days) and frequency (daily or weekly)
- Regulatory events displayed alongside article synthesis in results
- Unread count tracking per alert
- View and manage alert results inline
- Graceful degradation: if regulatory data is unavailable, alerts still run with newsroom articles only
Regulatory
Regulatory tracks renewable portfolio standards, utility rates, generation assets, and regulatory events by jurisdiction. Filter by jurisdiction (South Africa, Zimbabwe, US), state, fuel type, and year. The dashboard shows cached event counts, latest event dates, active sources, and US quantitative data (RPS compliance records, power cache).
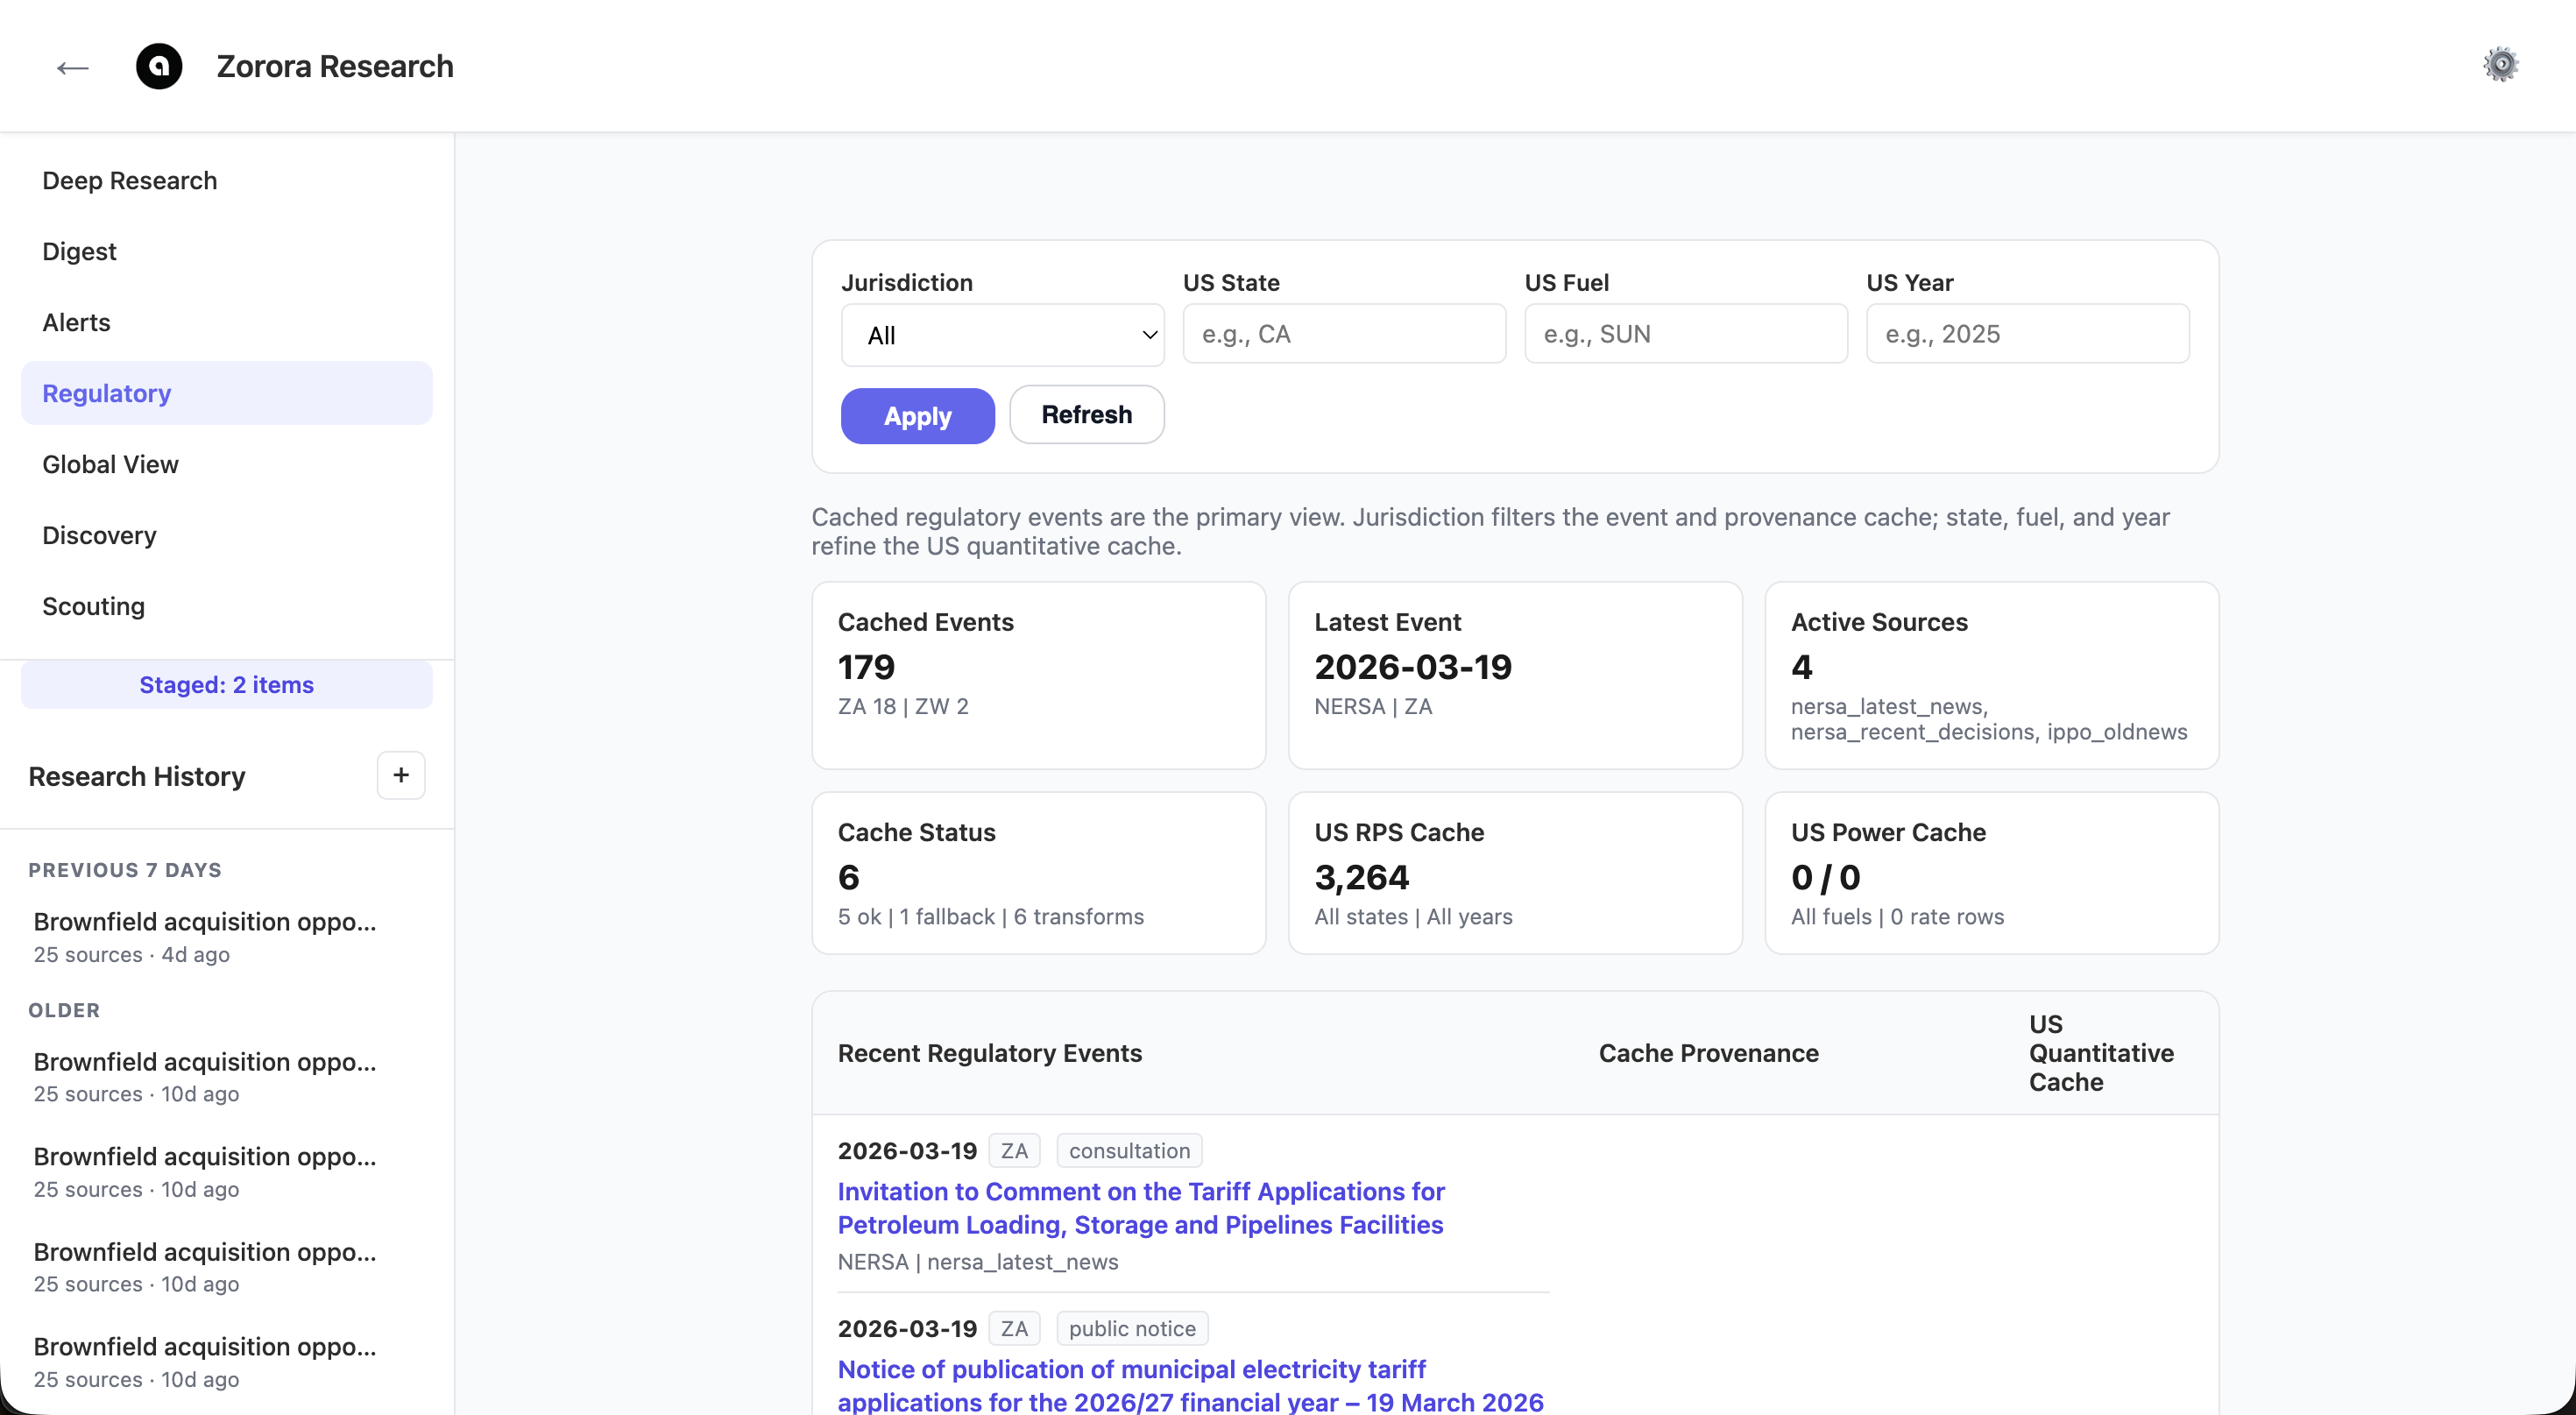
179 cached regulatory events across SA and ZW jurisdictions, with NERSA tariff decisions, public notices, and provenance tracking. US RPS cache holds 3,264 compliance records.
Key capabilities:
- 4 active regulatory sources: NERSA latest news, NERSA recent decisions, IPP Office old news, ZERA
- Jurisdiction filter for South Africa, Zimbabwe, and United States
- US quantitative cache: EIA generation/capacity data, state RPS targets, utility rates by location
- Cache provenance tracking showing source reliability status
- Direct links to original regulatory documents
Global View
Global View combines a geographic news map with live commodity and market data. The map shows geo-tagged articles as bubble markers sized by article count. Click any country to see a topic and source breakdown. Below the map, commodity dataset cards show real-time pricing from SAPP, Eskom, FRED, and other providers.
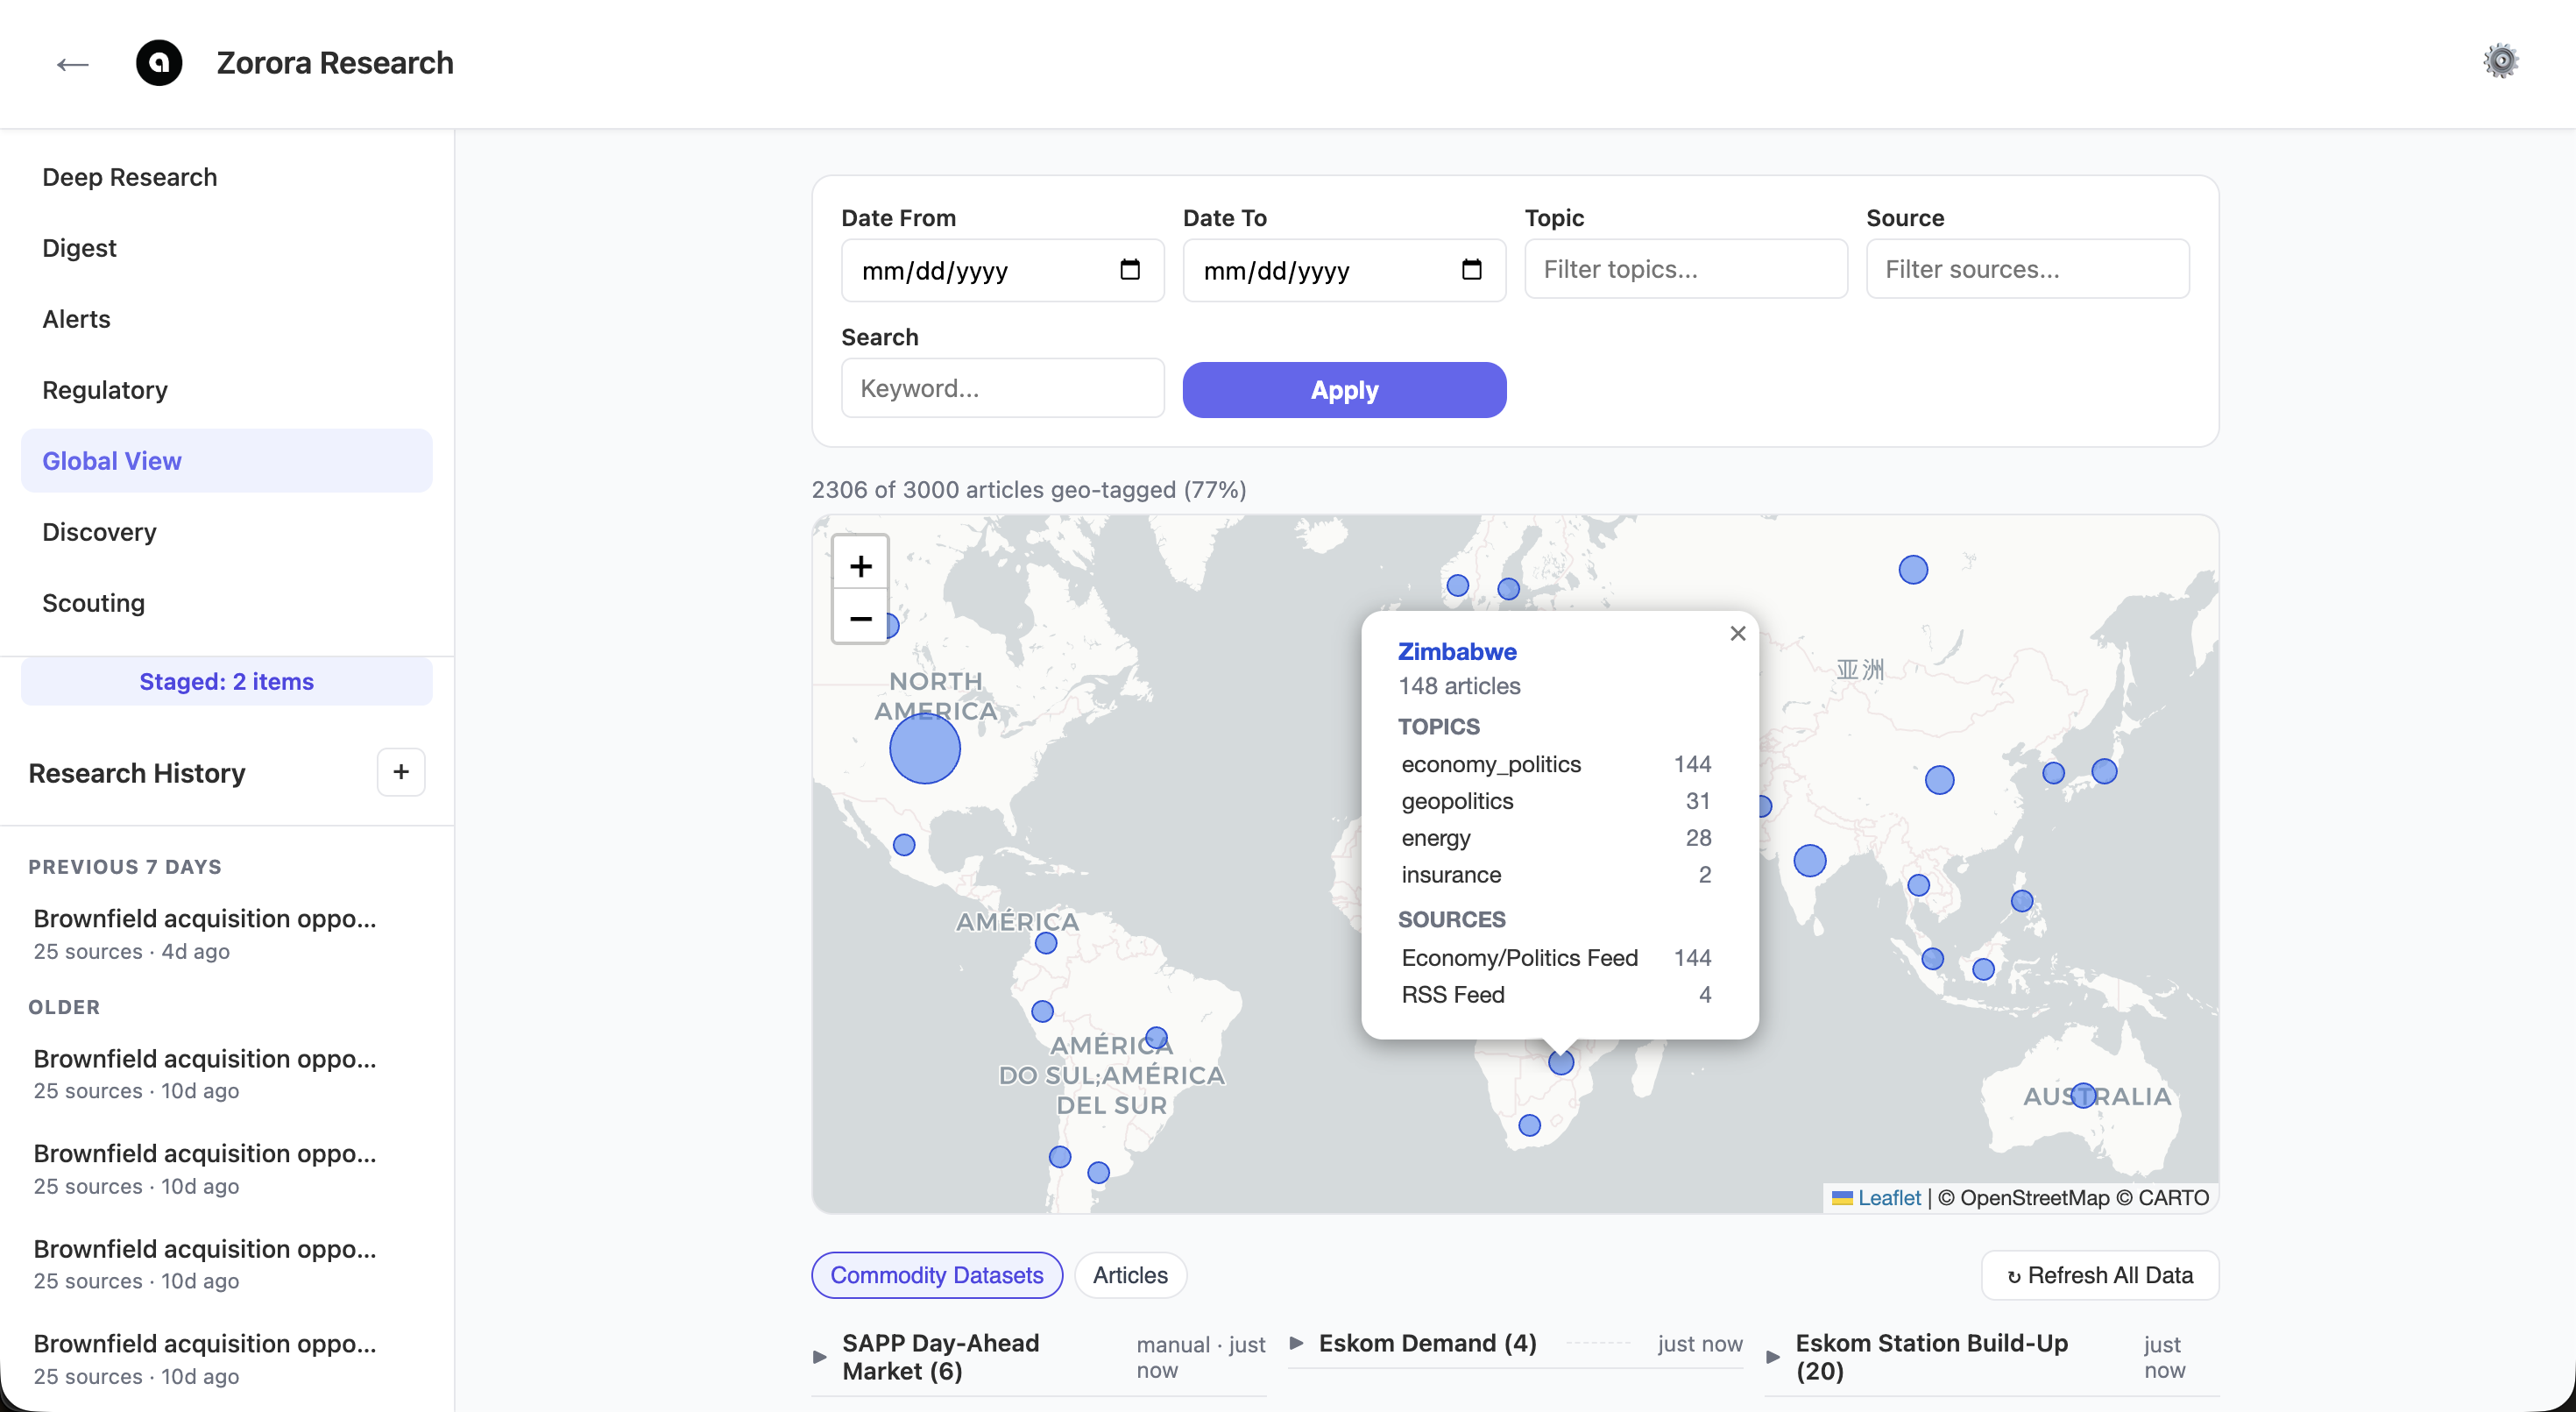
Country-level news map with Zimbabwe popup showing 148 articles broken down by topic (economy/politics, geopolitics, energy, insurance) and source
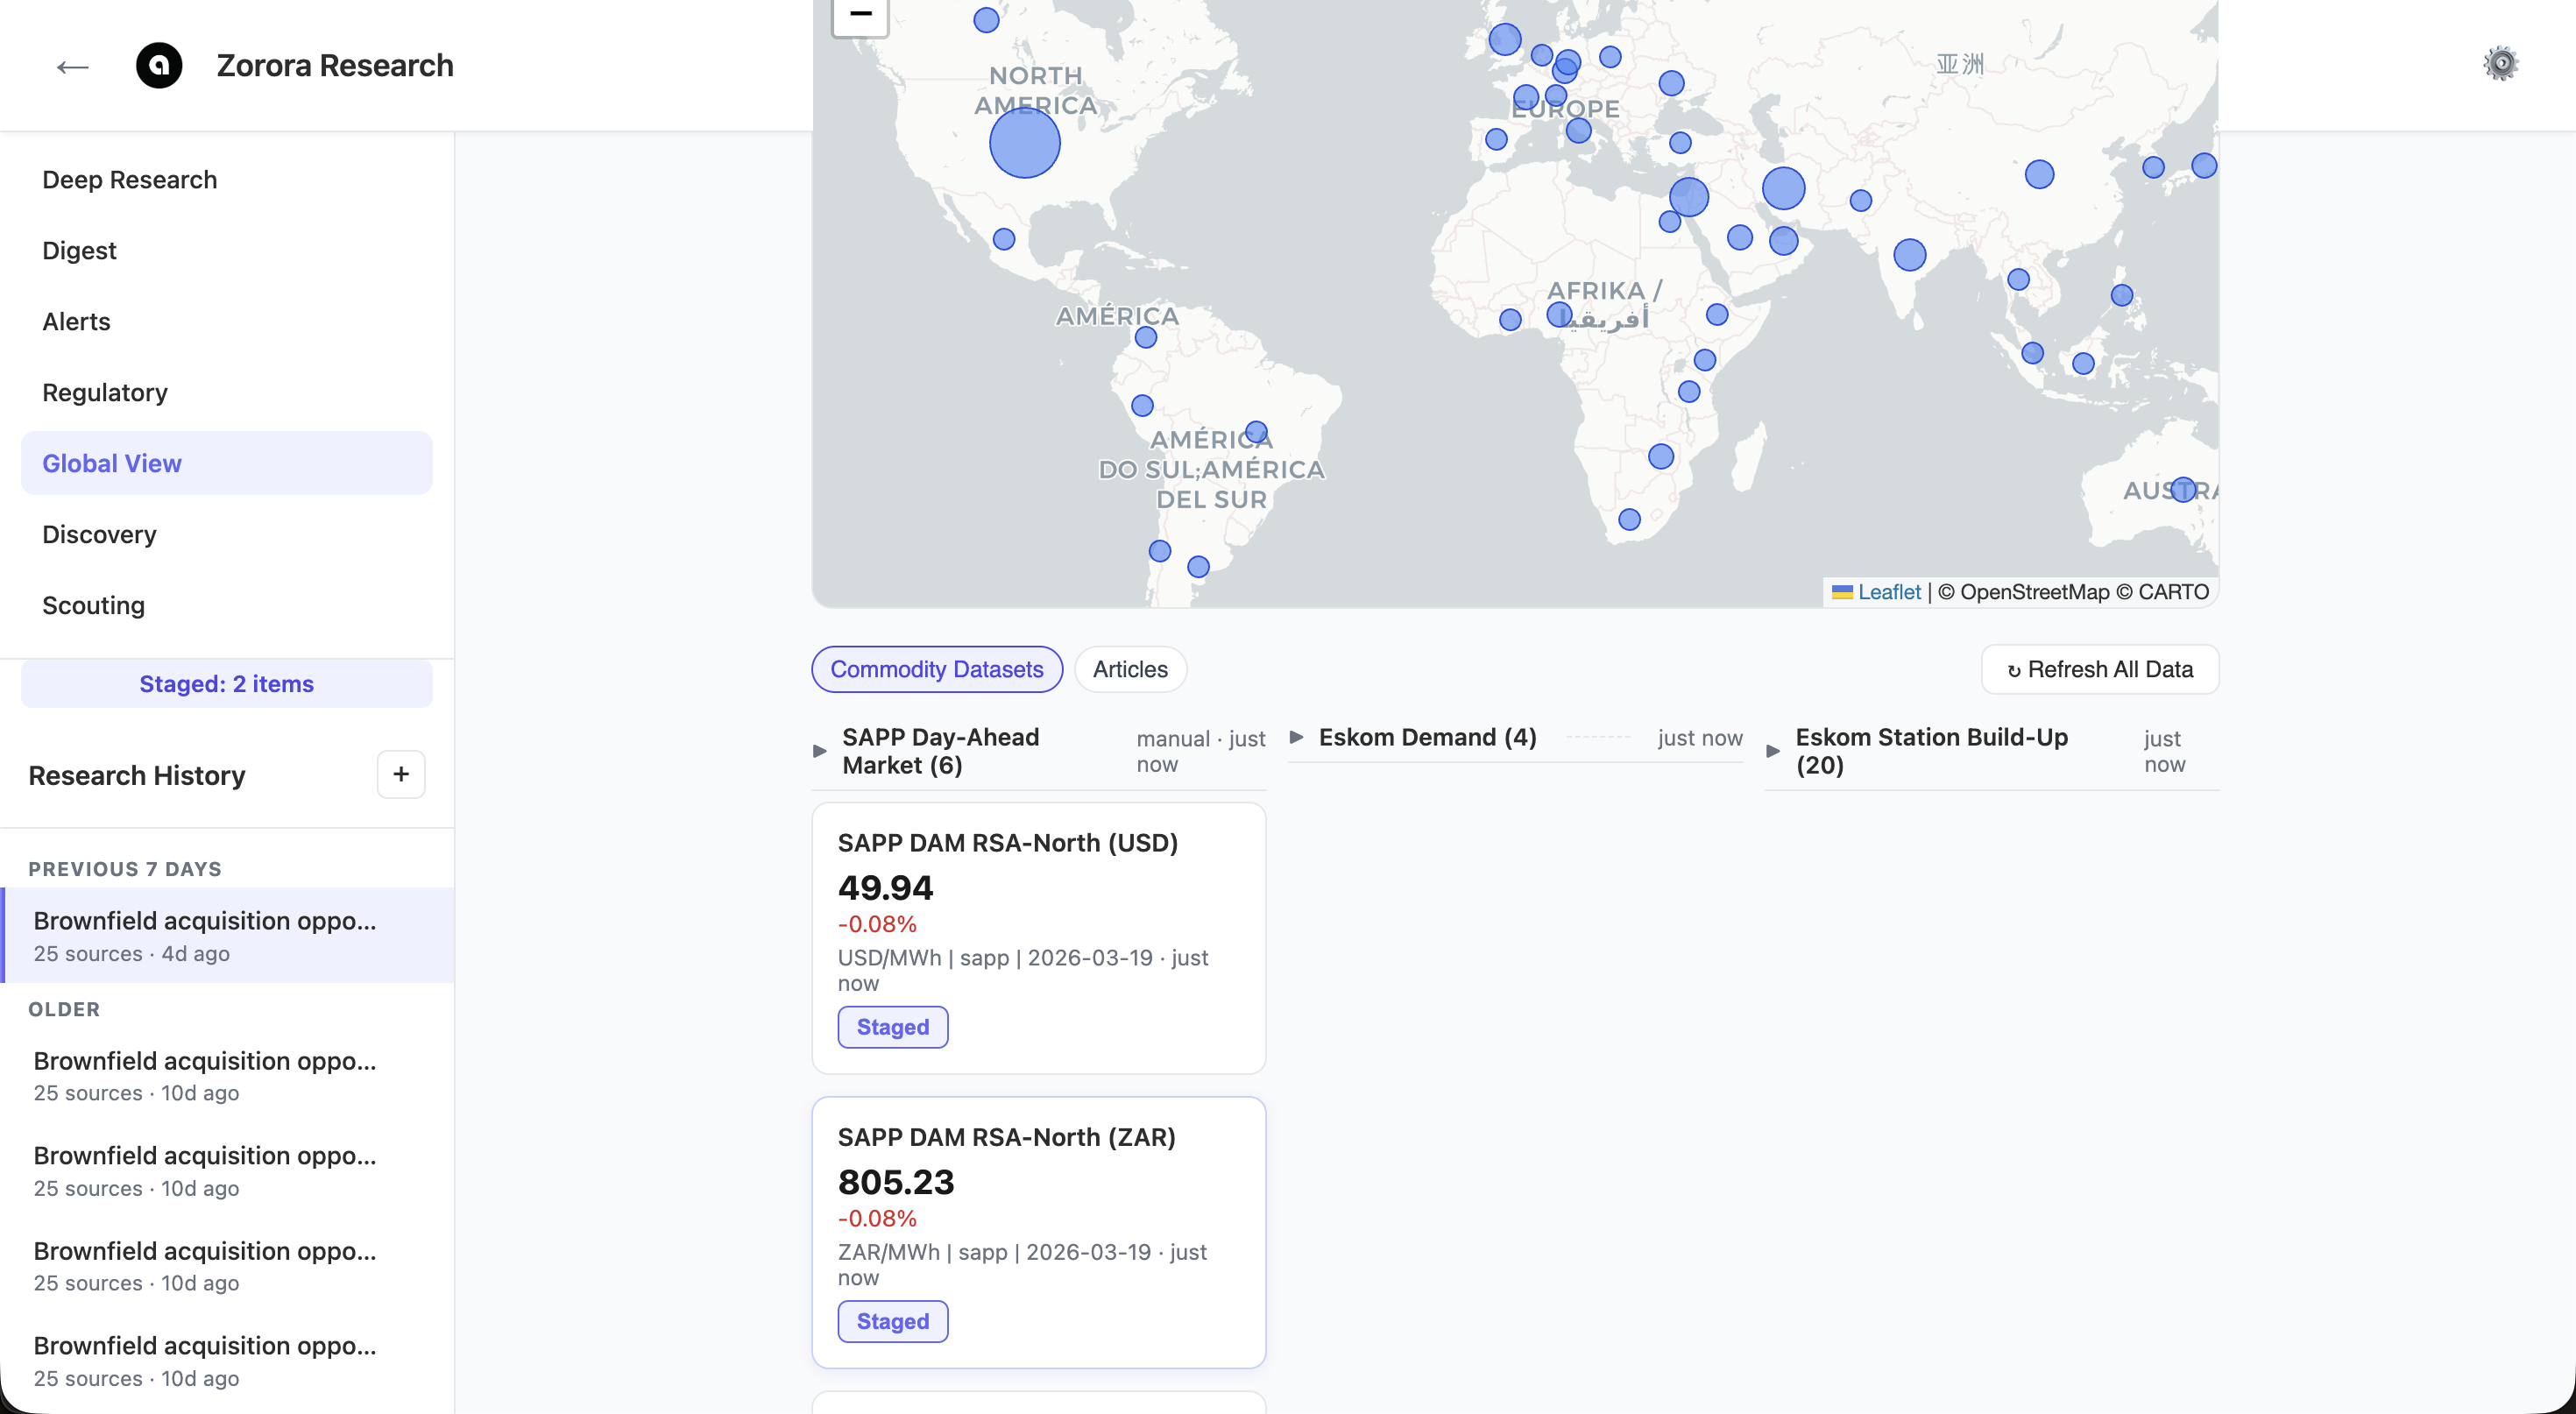
Commodity dataset cards showing SAPP DAM prices (RSA-North at $49.94/MWh, ZAR 805.23) with change indicators. Stage any card into a Digest synthesis.
Key capabilities:
- 2,306 geo-tagged articles across 169 countries with topic/source filtering
- Date range, topic, source, and keyword filters
- Toggle between Commodity Datasets and Articles views
- SAPP Day-Ahead Market (6 series), Eskom Demand (4 series), Eskom Station Build-Up (20 series)
- Stage any dataset or article into Digest for synthesis
- Refresh All Data to pull latest observations from all providers
Discovery
Discovery is a Leaflet-based geospatial view showing mineral deposits, generation assets, mining concessions, and transmission infrastructure on satellite imagery. Toggle layers using the control panel. Click any asset to see its details and launch a research query, diligence search, or add it to the scouting pipeline.
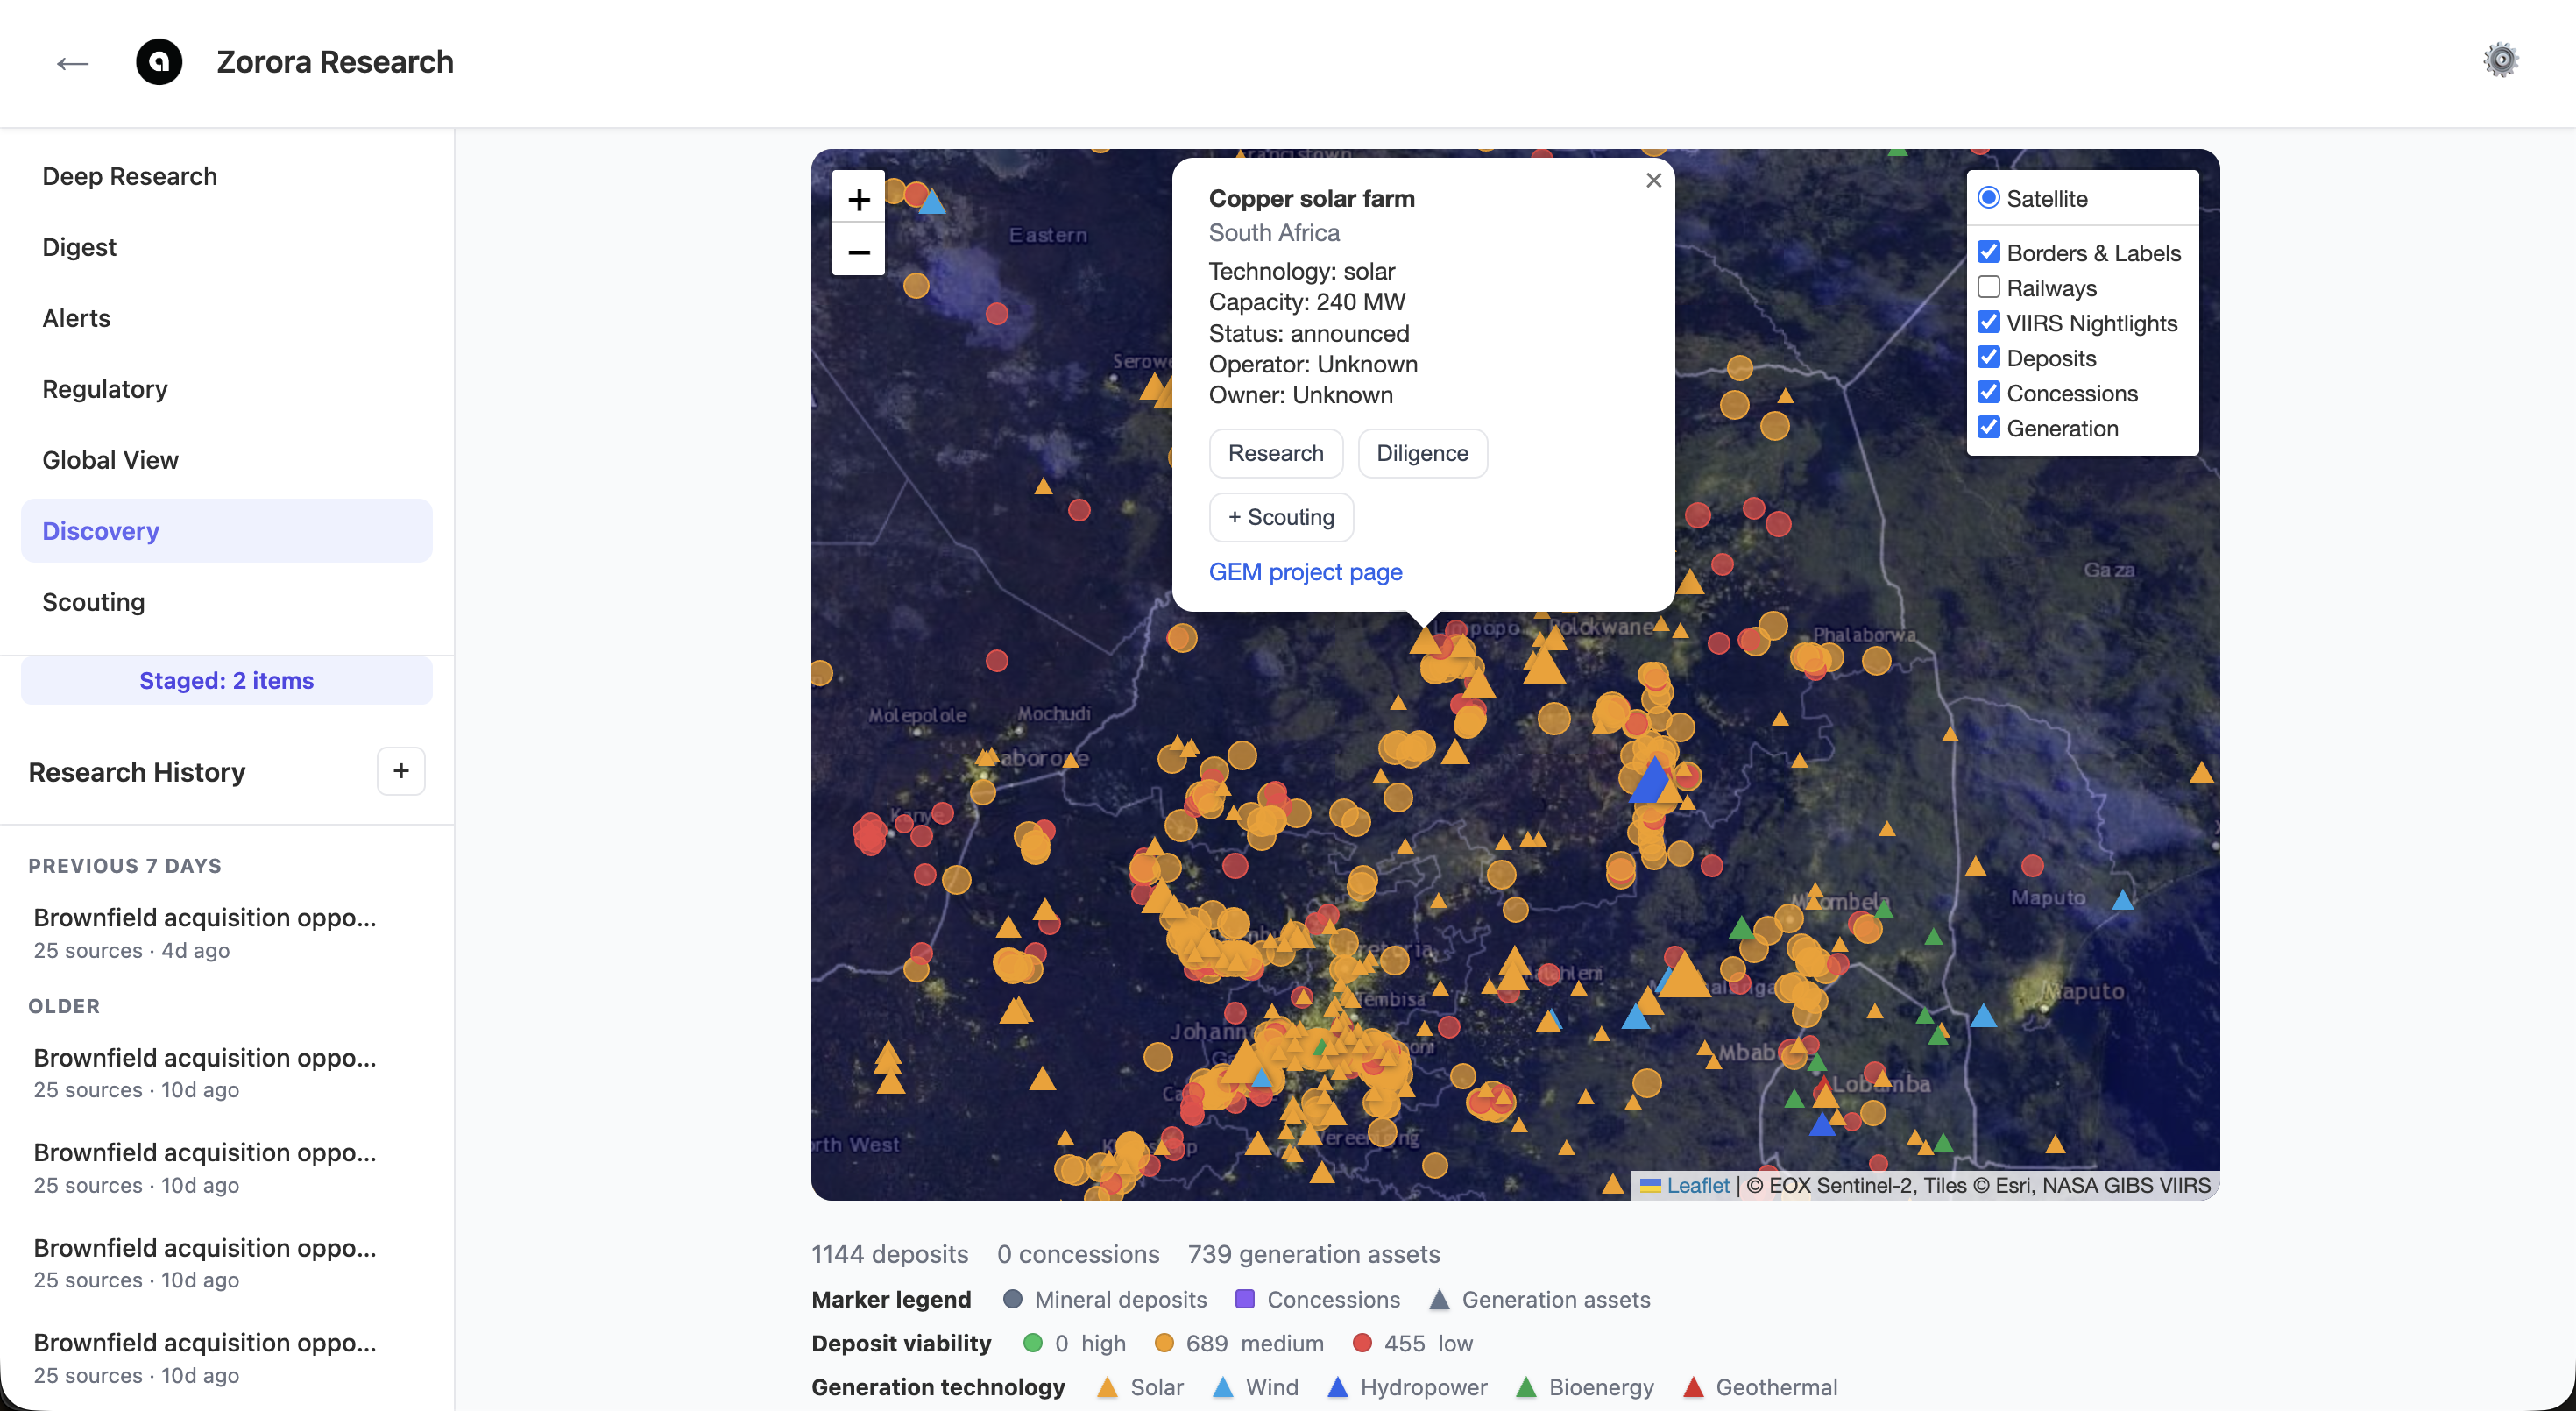
Satellite map showing 1,144 mineral deposits and 739 generation assets across southern Africa. Asset popup for Copper solar farm (240 MW, announced) with Research, Diligence, and +Scouting actions.
Key capabilities:
- Sentinel-2 satellite imagery with VIIRS night-light overlays
- Layer toggles: Borders & Labels, Railways, VIIRS Nightlights, Deposits, Concessions, Generation
- 1,144 mineral deposits with viability scoring (high/medium/low)
- 739 generation assets with capacity, technology, operator, and construction status
- Technology markers: Solar, Wind, Hydropower, Bioenergy, Geothermal
- One-click Research, Diligence, or +Scouting from any asset popup
- GEM project page links for external cross-reference
Scouting
Scouting is a kanban pipeline for tracking energy asset opportunities through five evaluation stages: Identified, Scored, Feasibility, Diligence, and Decision. Switch between Brownfield (existing assets), Greenfield (new site candidates), and BESS (battery storage) tabs. Each card shows the asset name, country, capacity, and available actions.
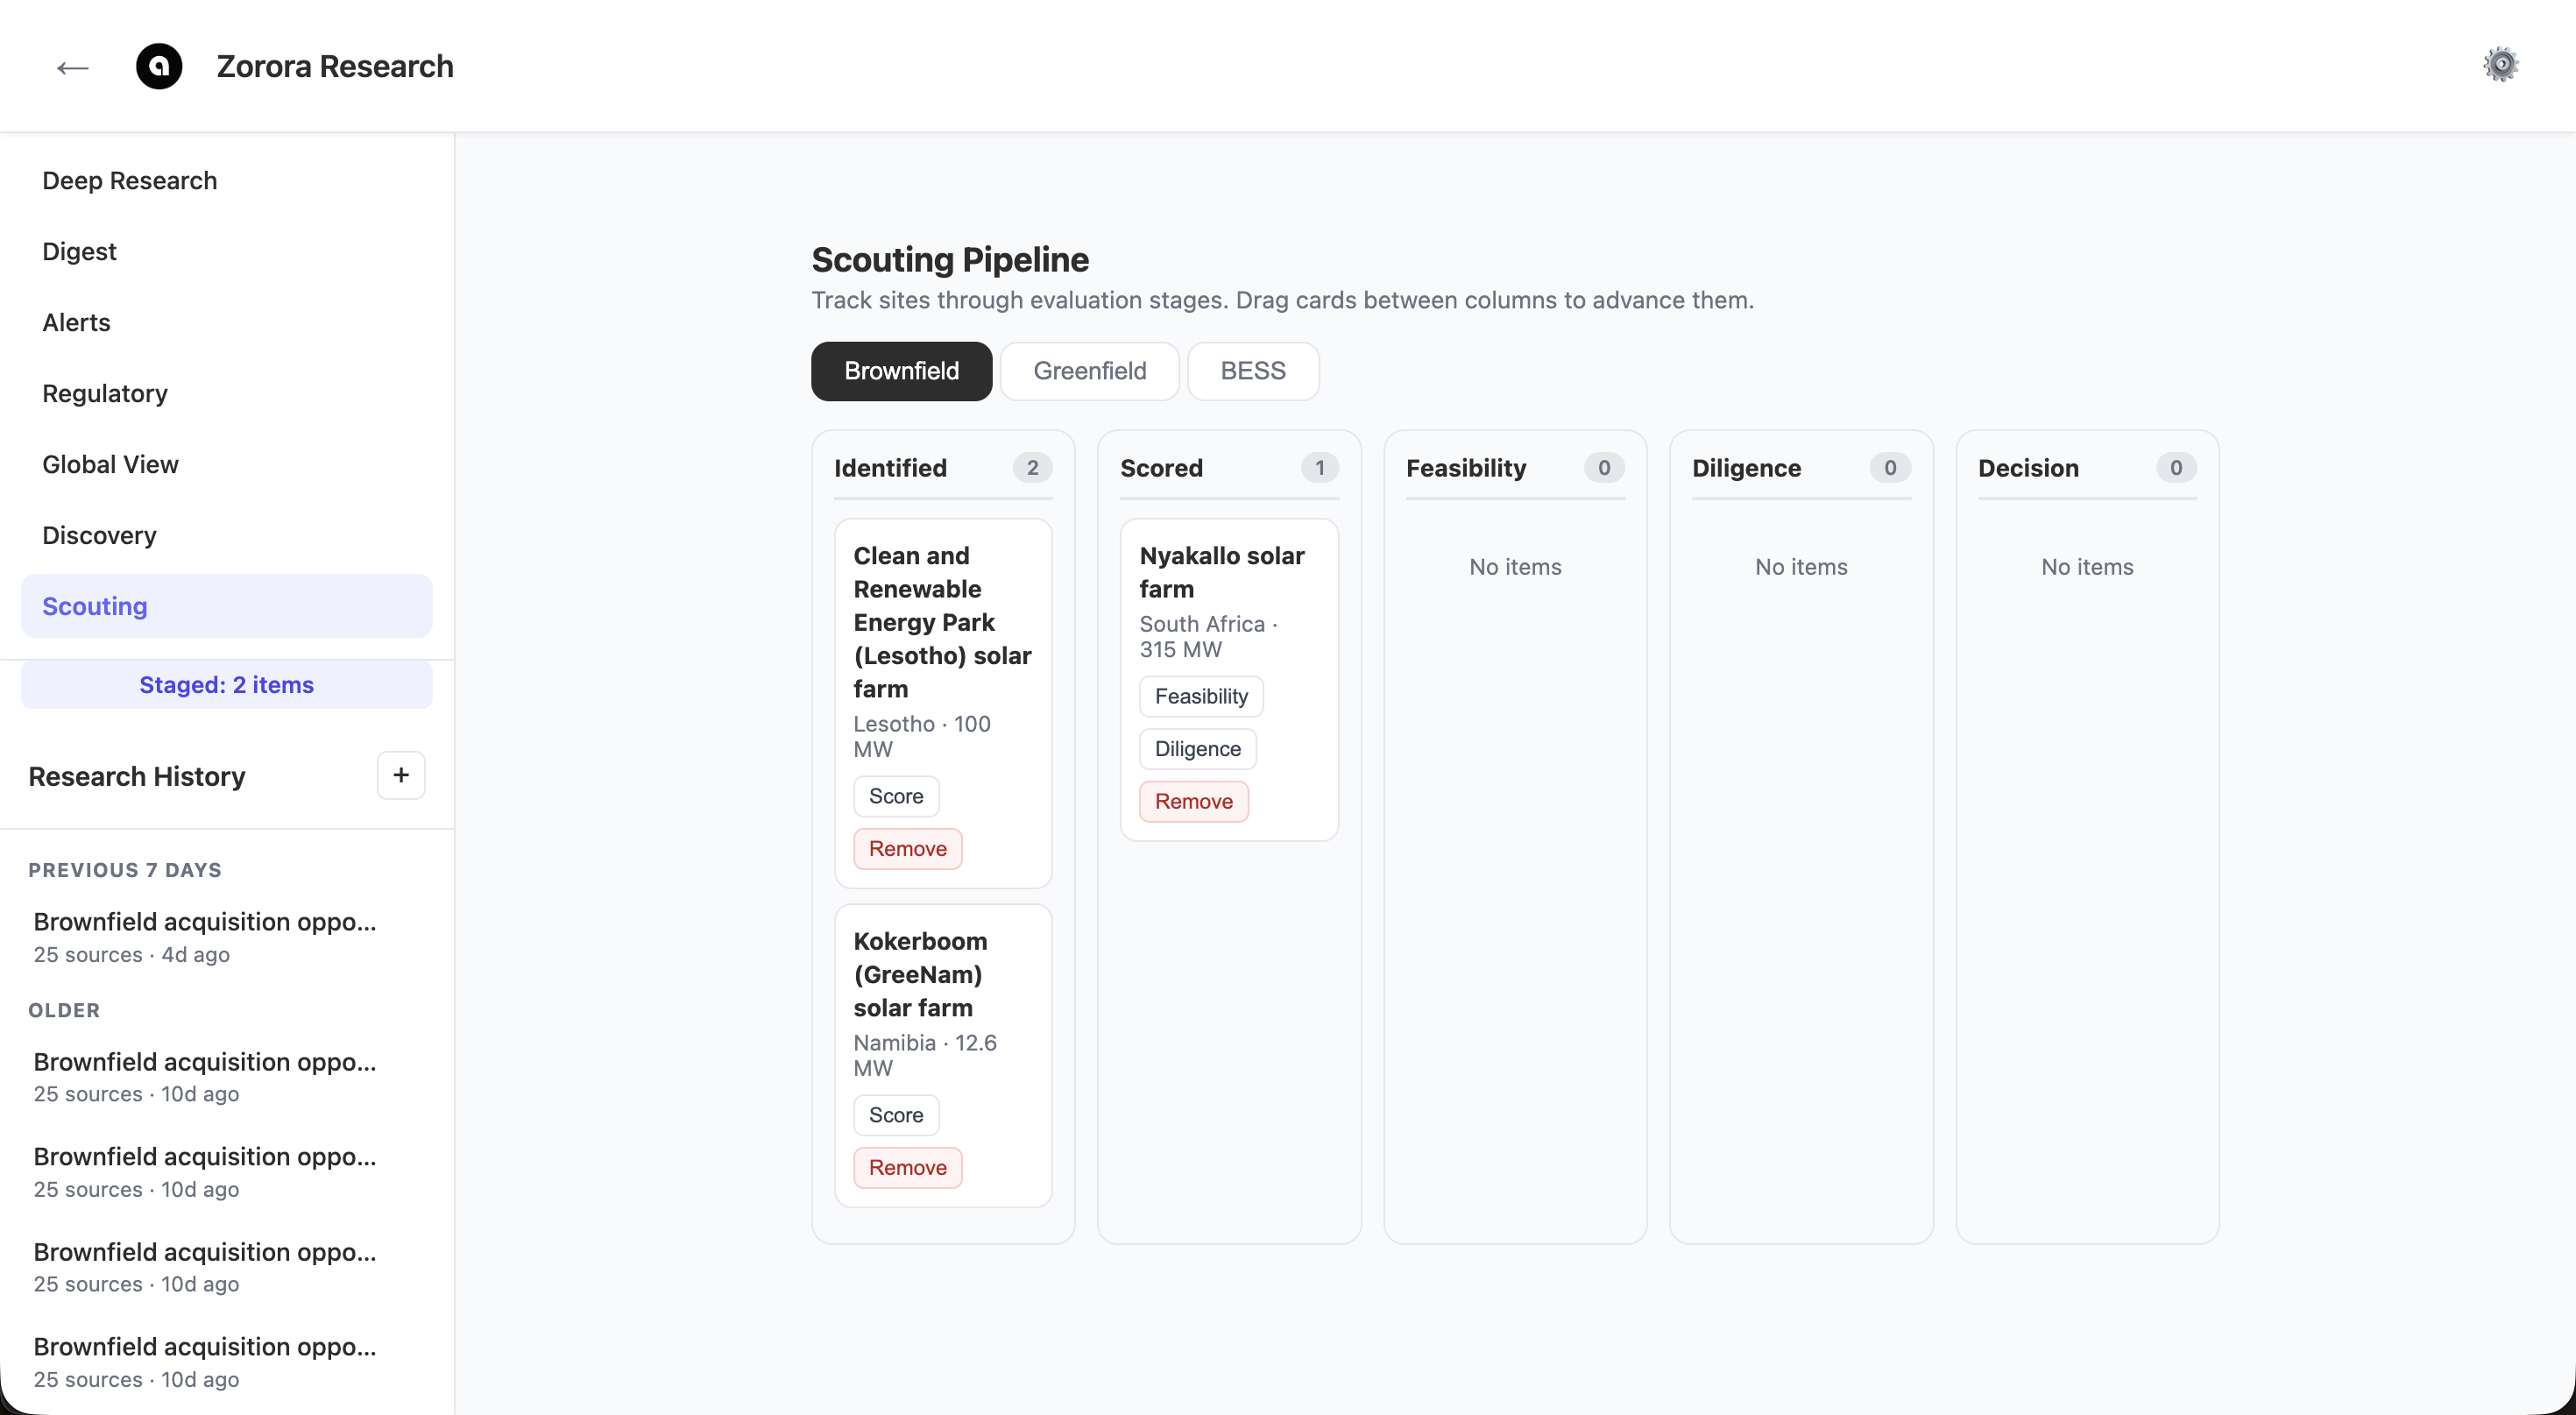
Brownfield kanban pipeline with 5 stages. Cards show asset details (country, capacity) with Feasibility, Diligence, Score, and Remove actions. Drag cards between columns to advance them.
Key capabilities:
- Three asset types: Brownfield, Greenfield, BESS
- Five pipeline stages: Identified, Scored, Feasibility, Diligence, Decision
- Automated feasibility studies across 5 dimensions: Production, Trading, Grid, Regulatory, Financial
- Each study includes LLM-synthesized conclusions, risk assessments, and confidence ratings
- Greenfield scoring using NASA POWER solar/wind resource data and grid proximity
- BESS scoring using DAM arbitrage spreads, TOU tariff differentials, and RE penetration
- Add assets from Discovery map via +Scouting action
Settings
Click the gear icon in the top-right corner to open the Settings modal. Configure which LLM model to use for each task (orchestrator, code generation, reasoning, search, vision) and select from multiple providers.
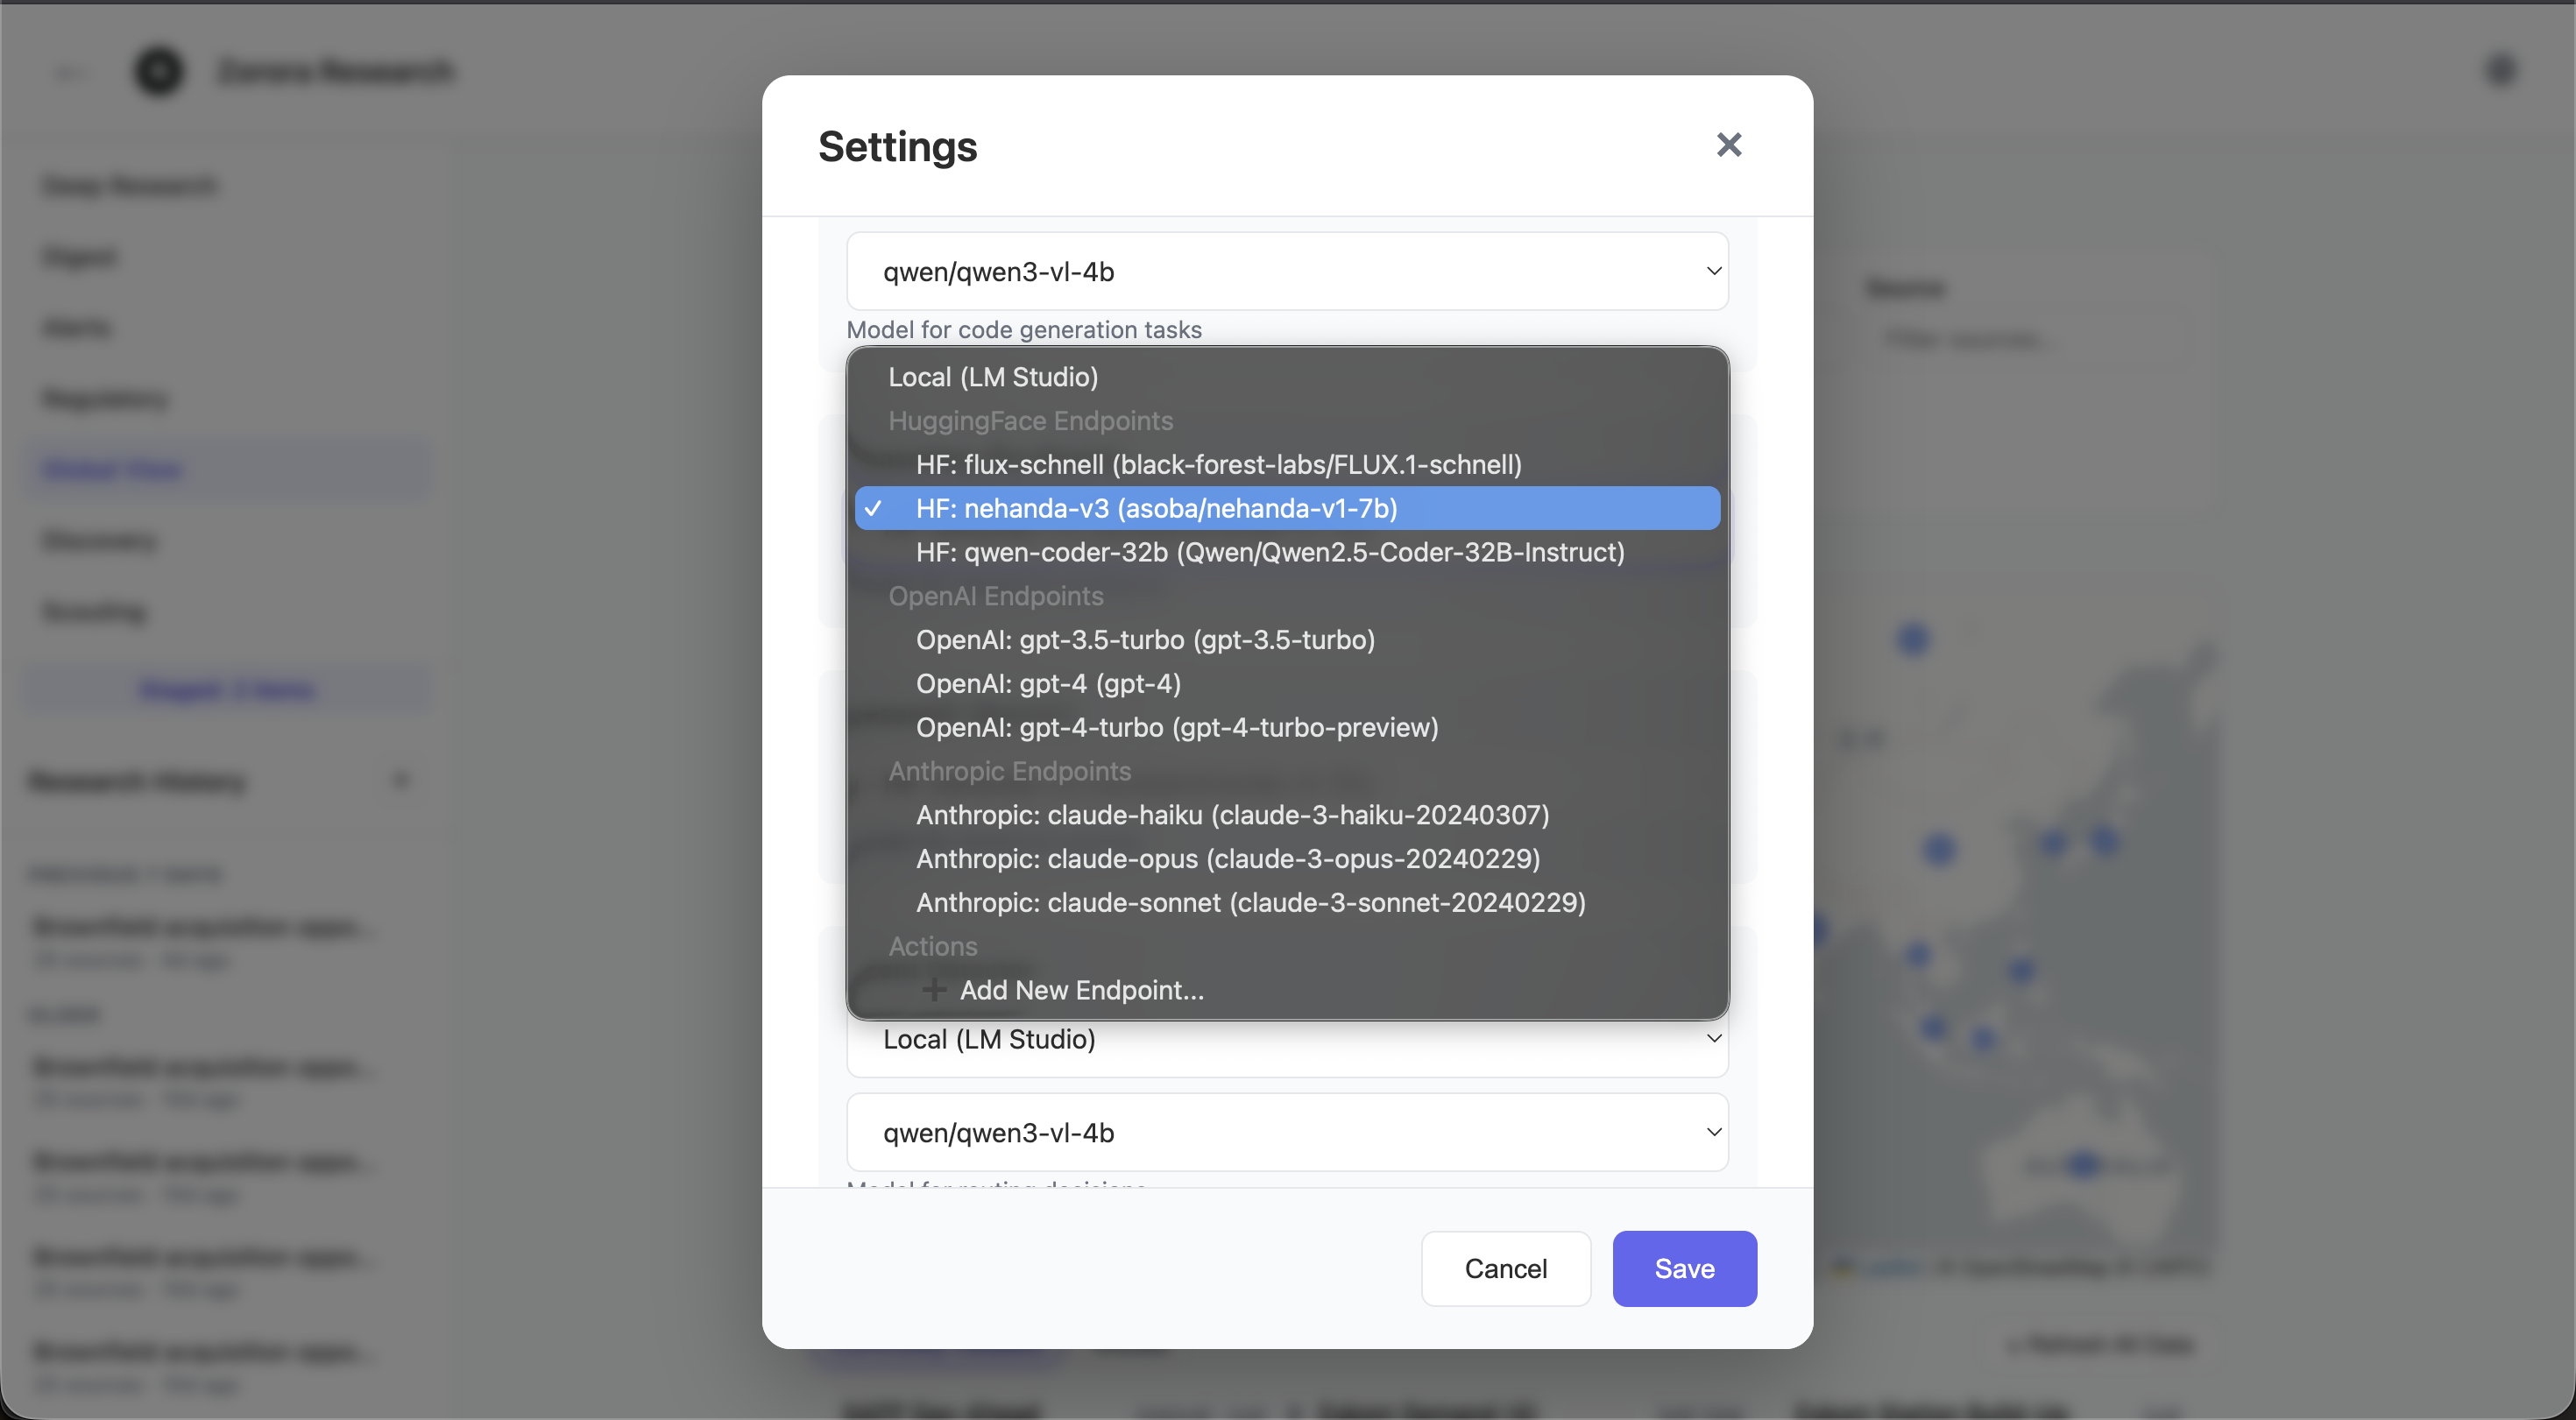
Settings modal showing model selection with providers: Local (LM Studio), HuggingFace Endpoints (nehanda-v3, qwen-coder-32b), OpenAI (GPT-3.5/4), and Anthropic (Claude Haiku/Opus/Sonnet)
Key capabilities:
- Model selection per task: orchestrator, codestral, reasoning, search, intent detector, vision, image generation
- Four provider categories: Local (LM Studio), HuggingFace, OpenAI, Anthropic
- Add custom endpoints with provider-specific configuration
- API key management with masked display and show/hide toggle
See Also
- Introduction — Platform overview and architecture
- Getting Started — Installation and first query
- Research Workflow — Deep research pipeline details
- Diligence Search — Brownfield due diligence patterns
- Configuration — Config file reference