Diligence Search
Run structured acquisition due diligence on renewable energy assets — from the Web UI. Zorora decomposes your query into domain-specific searches (tariffs, licensing, environmental, performance, counterparty), retrieves and groups sources by domain, and synthesizes a structured diligence report with embedded charts.
Scenario
You are evaluating a brownfield solar asset in Lesotho for acquisition. You need to assess:
- Electricity tariff rates and PPA structures
- Licensing and regulatory requirements (LEWA)
- Environmental impact and grid connection procedures
- Measured capacity factors vs design assumptions
- Counterparty track record (offtaker, developer, grid operator)
- Asset-specific news and ownership history
Diligence report for a Lesotho solar asset — domain-specific sections with inline source citations and embedded revenue/performance charts
How It Works
Step 1: Select a Brownfield Asset
In the Web UI’s Imaging mode, click on a generation asset marker to open its detail popup. Click “Run Diligence Search” to pre-fill the search with the asset’s metadata (name, country, technology, capacity, operator).
Alternatively, in Deep Research mode, type a diligence query directly:
Due diligence on Letseng Solar 100MW in Lesotho
Step 2: Automatic Query Decomposition
Zorora decomposes the query into 6 domain-specific search intents:
| Domain | Example Query |
|---|---|
| Commercial | "Lesotho independent power producer power purchase agreement solar tariff rates" |
| Licensing | "Lesotho solar power generation license application requirements electricity regulator" |
| Environmental | "Lesotho environmental impact assessment grid connection requirements solar 100MW" |
| Performance | "Solar power plant capacity factor performance ratio measured data Lesotho" |
| Counterparty | "Lesotho solar power project developer IPP offtake agreement utility" |
| Asset-specific | "Letseng Solar Lesotho solar acquisition renewable energy investment" |
Each intent searches across web, academic, and newsroom backends. Sources are tagged with their originating domain for per-section grouping in the synthesis.
Step 3: Domain-Aware Synthesis
The synthesis model receives sources grouped by domain, with per-section analytical questions:
- Executive Summary — Key diligence findings and risk/opportunity highlights
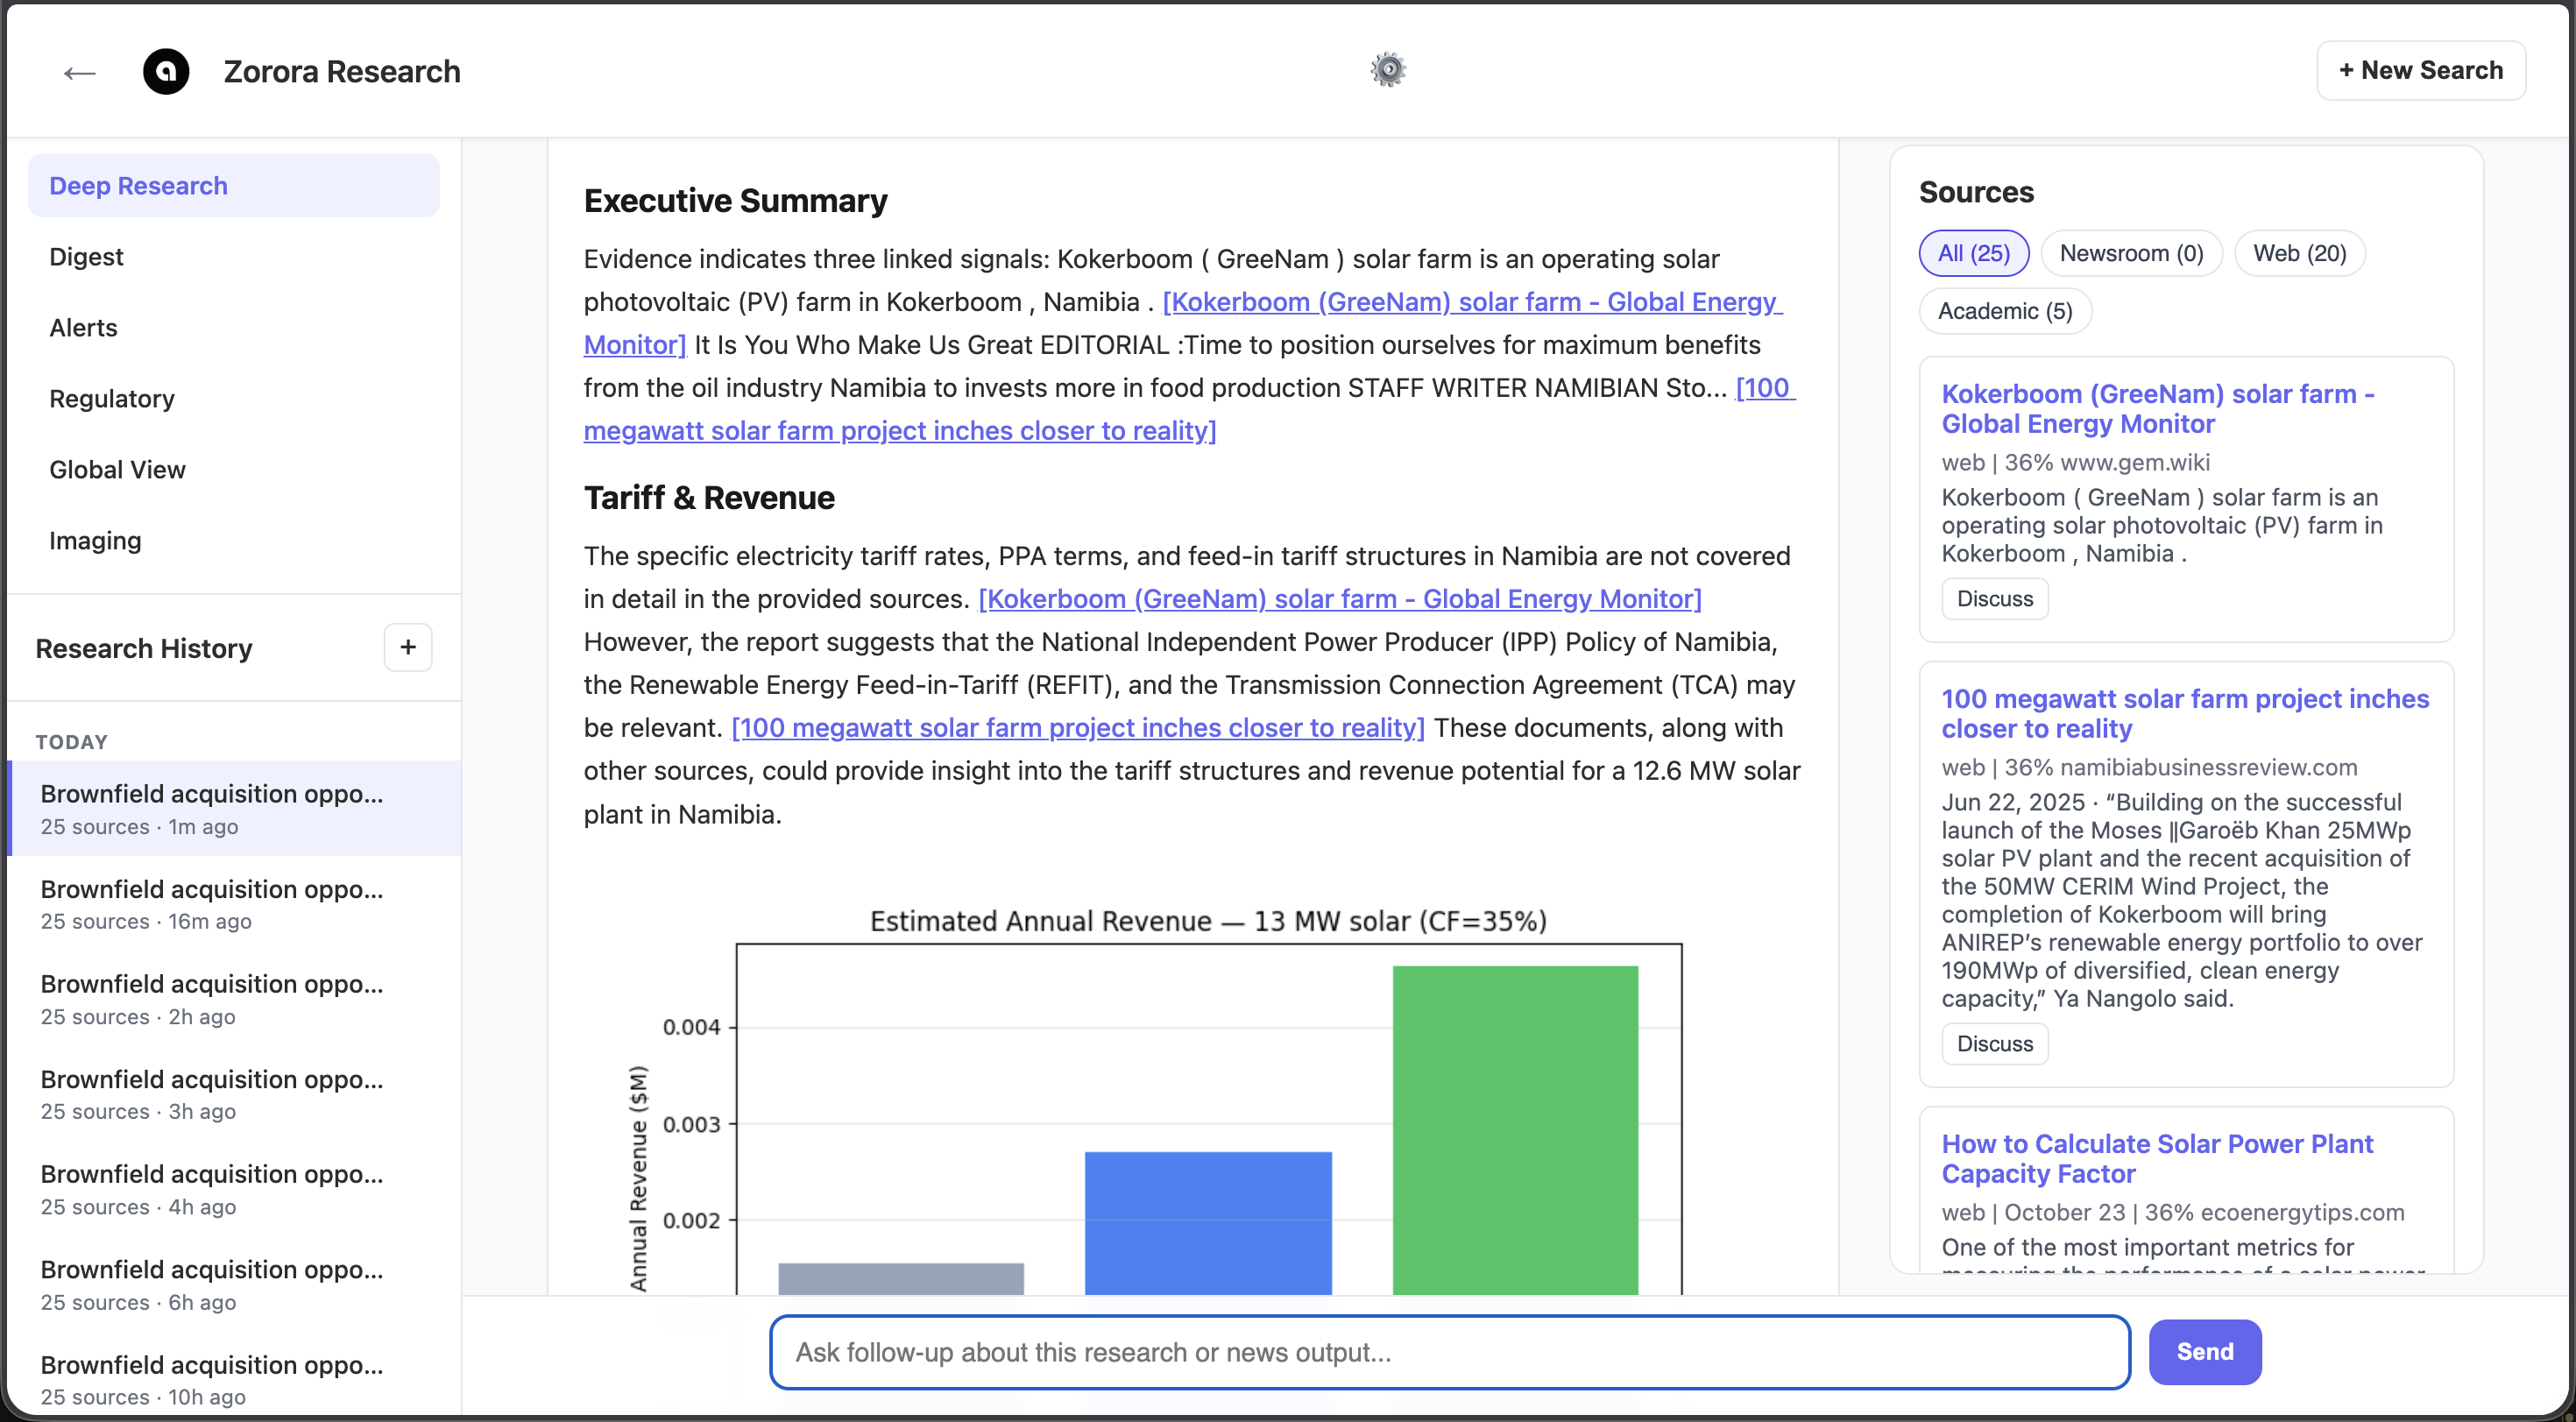
- Tariff & Revenue Potential — PPA terms, feed-in tariff rates, estimated annual revenue
- Regulatory & Licensing Requirements — Permits, regulator, licensing process
- Environmental & Grid Integration — EIA requirements, grid connection procedures
- Technical Performance Assessment — Measured capacity factors, performance ratios
- Counterparty & Vendor Analysis — Offtaker, developer, and operator track record
- Risk Summary & Recommendation — Cross-domain risk synthesis with acquisition recommendation
Step 4: Embedded Charts
If structured data is available (EIA generation assets, utility rate schedules, World Bank indicators), Zorora embeds matplotlib charts directly into the report:
- Revenue waterfall (tariff x capacity x capacity factor)
- Regional capacity factor comparison
- Technology mix breakdown
What Makes It Different
| Feature | Standard Deep Research | Diligence Search |
|---|---|---|
| Query decomposition | Open-ended subtopics | 6 fixed domain intents |
| Source grouping | Flat ranked list | Per-domain buckets |
| Synthesis prompt | Generic analyst | Investment committee audience |
| Output format | Direct Answer + themes | 6 domain sections + executive summary |
| Quality gate | Requires “Direct Answer” | Requires domain section titles |
| Charts | None | Revenue, performance, technology mix |
Best Practices
Asset Metadata
- Provide country, technology, and capacity for the best results — these parameterize the analytical questions in each section
- Include operator or developer name if known — enables counterparty and asset-specific searches
Interpreting Results
- Sections marked [Background Knowledge] indicate the model used general knowledge rather than retrieved sources — treat these with lower confidence
- Source citations in [square brackets] link to the ranked source list at the bottom
- Empty sections with explicit gap statements indicate no relevant sources were found for that domain
See Also
- Web UI Guide — Starting the Web UI and using research modes
- Energy Data Exploration — Analyze solar production data with pandas
- Research Pipeline — How the deep research engine works